

doi: 10.12688/wellcomeopenres.23691.1.
eCollection 2025.
The genome sequence of the greater argentine, Argentina silus (Ascanius, 1775)
Affiliations
- PMID: 40574744
- PMCID: PMC12198749
- DOI: 10.12688/wellcomeopenres.23691.1
Item in Clipboard
The genome sequence of the greater argentine, Argentina silus (Ascanius, 1775)
Wellcome Open Res.
.
Abstract
We present a genome assembly from a male specimen of Argentina silus (the greater argentine; Chordata; Actinopteri; Argentiniformes; Argentinidae). The genome sequence has a total length of 670.70 megabases. Most of the assembly is scaffolded into 24 chromosomal pseudomolecules, including the X and Y sex chromosomes. The mitochondrial genome has also been assembled and is 16.64 kilobases in length. Gene annotation of this assembly on Ensembl identified 19,422 protein-coding genes.
Keywords: Argentina silus; Argentiniformes; chromosomal; genome sequence; greater argentine.
Copyright: © 2025 Vang HBM et al.
Conflict of interest statement
No competing interests were disclosed.
Figures


The BlobToolKit snail plot shows N50 metrics and BUSCO gene completeness. The main plot is divided into 1,000 size-ordered bins around the circumference with each bin representing 0.1% of the 670,765,936 bp assembly. The distribution of scaffold lengths is shown in dark grey with the plot radius scaled to the longest scaffold present in the assembly (54,096,584 bp, shown in red). Orange and pale-orange arcs show the N50 and N90 scaffold lengths (24,540,466 and 15,361,704 bp), respectively. The pale grey spiral shows the cumulative scaffold count on a log scale with white scale lines showing successive orders of magnitude. The blue and pale-blue area around the outside of the plot shows the distribution of GC, AT and N percentages in the same bins as the inner plot. A summary of complete, fragmented, duplicated and missing BUSCO genes in the actinopterygii_odb10 set is shown in the top right. An interactive version of this figure is available at
https://blobtoolkit.genomehubs.org/view/fArgSil1_1/dataset/fArgSil1_1/snail .

The circles represent scaffolds, with the size proportional to scaffold length and the colour representing phylum membership. The histograms along the axes display the total length of sequences distributed across different levels of coverage and GC content. An interactive version of this figure is available at
https://blobtoolkit.genomehubs.org/view/fArgSil1_1/dataset/fArgSil1_1/blob .
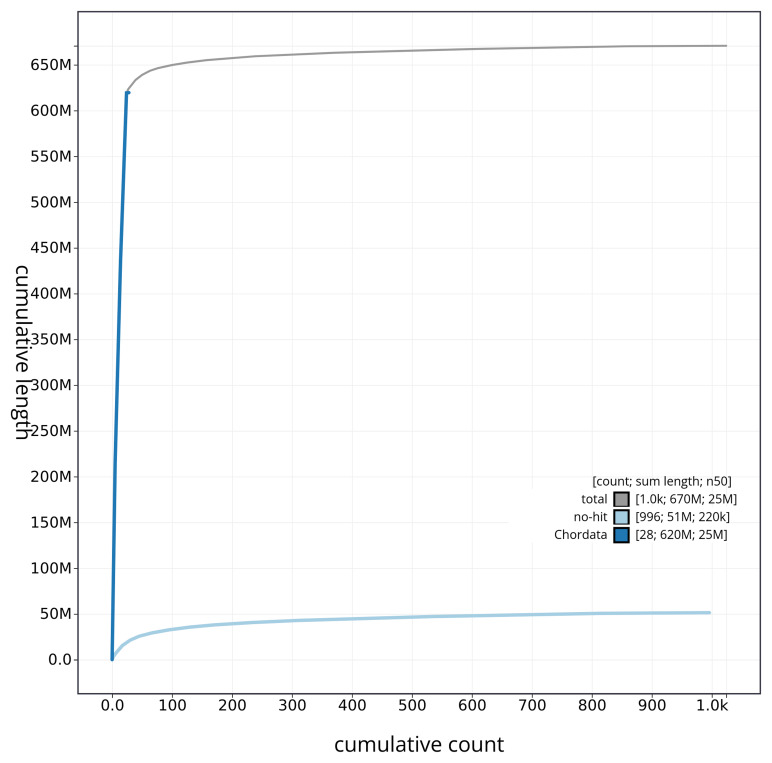
The grey line shows cumulative length for all sequences. Coloured lines show cumulative lengths of sequences assigned to each phylum using the buscogenes taxrule. An interactive version of this figure is available at
https://blobtoolkit.genomehubs.org/view/fArgSil1_1/dataset/fArgSil1_1/cumulative .

Chromosomes are shown in order of size from left to right and top to bottom. An interactive version of this figure may be viewed at
https://genome-note-higlass.tol.sanger.ac.uk/l/?d=eyZ0NUKYR1agttl3NllTuQ .
References
-
- Árnason E: A report on the mitochondrial DNA variation of the great silver smelt. Argentina silus,2017.
LinkOut - more resources
Full Text Sources
