

Highly multiplexed molecular inversion probe panel in Plasmodium falciparum targeting common SNPs approximates whole-genome sequencing assessments for selection and relatedness
- PMID: 40574802
- PMCID: PMC12198981
- DOI: 10.3389/fgene.2025.1526049
Highly multiplexed molecular inversion probe panel in Plasmodium falciparum targeting common SNPs approximates whole-genome sequencing assessments for selection and relatedness
Abstract
Introduction: The use of next-generation sequencing technologies (NGS) to study parasite populations and their response and evolution to interventions is important to support malaria control and elimination efforts. While whole-genome sequencing (WGS) is optimal in terms of assessing the entire genome, it is costly for numerous samples. Targeted approaches selectively enriching for the sequence of interest are more affordable and have higher throughput but sometimes lack adequate information content for key analyses.
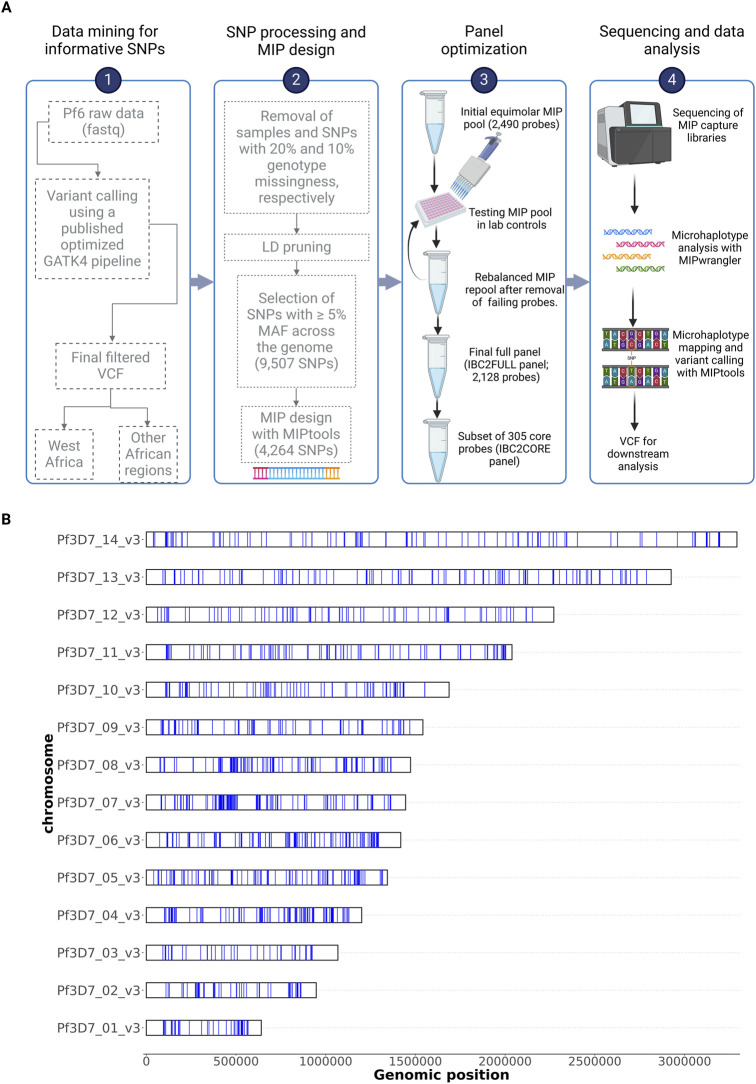
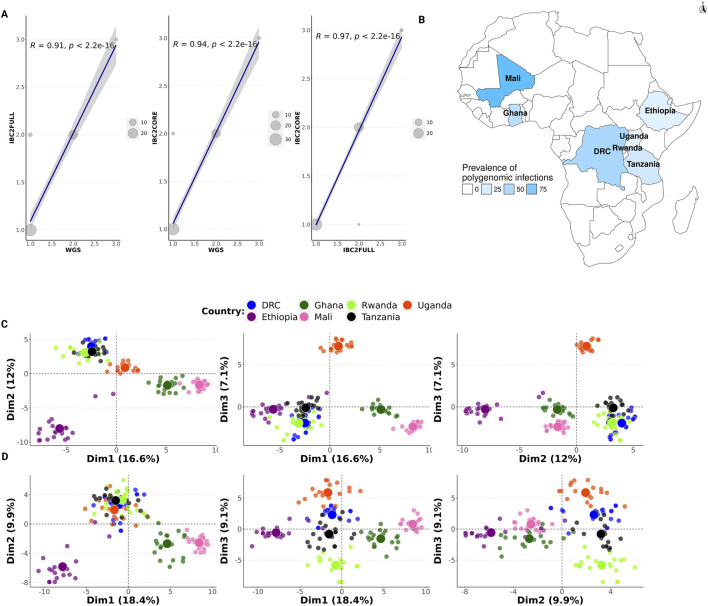
Methods: We have developed a highly multiplexed molecular inversion probe (MIP) panel (IBC2FULL) targeting 4,264 single-nucleotide polymorphisms (SNPs) with ≥5% minor allele frequency (MAF) in Sub-Saharan African regions from publicly available Plasmodium falciparum WGS (n = 3,693). We optimized the panel alone and in combination with antimalarial drug resistance MIPs in laboratory P. falciparum strains at different parasitemias and validated it by sequencing field isolates from the Democratic Republic of Congo, Ethiopia, Ghana, Mali, Rwanda, Tanzania, and Uganda and evaluating the population structure, identity-by-descent (IBD), signals of selection, and complexity of infection (COI).
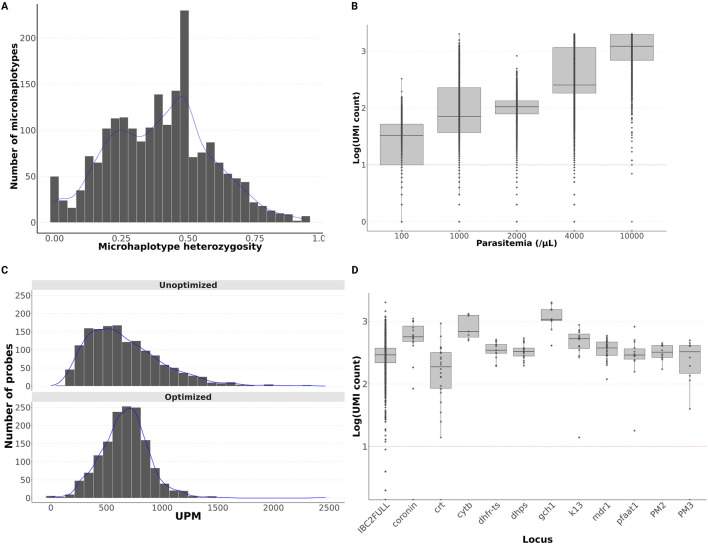
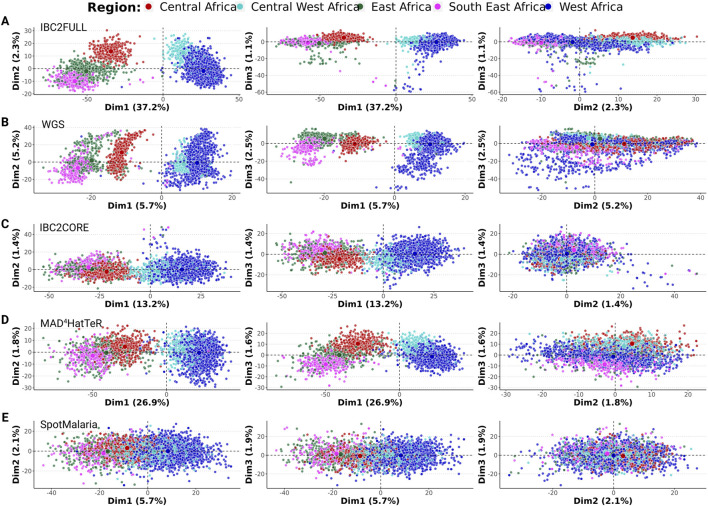
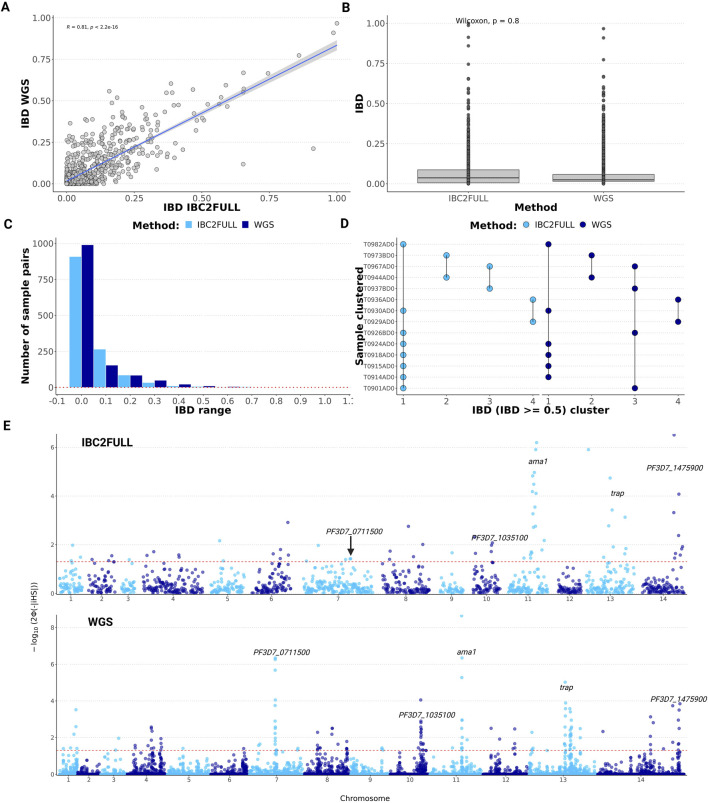
Results: The new panel IBC2FULL consisted of 2,128 MIPs (containing 4,264 common SNPs) spaced by 5.1-18.4 kb across the entire genome. While these microhaplotypes were developed based on variations from Sub-Saharan African WGS data, 59.3% (2,529) of SNPs were also common in Southeast Asia. The MIPs were balanced to produce more a uniform and higher depth of coverage at low parasitemia (100 parasites/μL) along with MIPs targeting antimalarial drug resistance genes. Comparing targeted regions extracted from public WGS, we observed that IBC2FULL provided a higher resolution of the local population structure in Sub-Saharan Africa than current PCR-based targeted sequencing panels. For sequencing field samples (n = 140), IBC2FULL approximated WGS measures of relatedness, population structure, and COI. Interestingly, genome-wide analysis of extended haplotype homozygosity detected the same major peaks of selection as WGS. We also chose a subset of 305 high-performing MIPs to create a core panel (IBC2CORE) that produced high-quality data for basic population genomic analysis and accurate estimation of COI.
Discussion: IBC2FULL and IBC2CORE panels have been designed to provide an improved platform for malaria genomic epidemiology and biology that can approximate WGS for many applications and is deployable for malaria molecular surveillance in resource-limited settings.
Keywords: Plasmodium falciparum; genomic epidemiology; malaria; molecular inversion probe; molecular surveillance; targeted sequencing.
Copyright © 2025 Niaré, Crudale, Fola, Wernsman Young, Asua, Conrad, Gashema, Ghansah, Hangi, Ishengoma, Mazarati, Zeleke, Rosenthal, Djimdé, Juliano and Bailey.
Conflict of interest statement
The authors declare that the research was conducted in the absence of any commercial or financial relationships that could be construed as a potential conflict of interest.
Figures
Update of
-
Highly multiplex molecular inversion probe panel in Plasmodium falciparum targeting common SNPs approximates whole genome sequencing assessments for selection and relatedness.medRxiv [Preprint]. 2025 Mar 13:2025.03.07.25323597. doi: 10.1101/2025.03.07.25323597. medRxiv. 2025. Update in: Front Genet. 2025 Jun 12;16:1526049. doi: 10.3389/fgene.2025.1526049. PMID: 40162260 Free PMC article. Updated. Preprint.
Similar articles
-
Highly multiplex molecular inversion probe panel in Plasmodium falciparum targeting common SNPs approximates whole genome sequencing assessments for selection and relatedness.medRxiv [Preprint]. 2025 Mar 13:2025.03.07.25323597. doi: 10.1101/2025.03.07.25323597. medRxiv. 2025. Update in: Front Genet. 2025 Jun 12;16:1526049. doi: 10.3389/fgene.2025.1526049. PMID: 40162260 Free PMC article. Updated. Preprint.
-
An expanded method for malaria parasite genetic surveillance using targeted nanopore sequencing.Gates Open Res. 2025 Jul 24;9:49. doi: 10.12688/gatesopenres.16355.1. eCollection 2025. Gates Open Res. 2025. PMID: 40718588 Free PMC article.
-
Performance of Molecular Inversion Probe DR23K and Paragon MAD4HatTeR Amplicon Sequencing Panels for Detection of Plasmodium falciparum Mutations Associated with Antimalarial Drug Resistance.Res Sq [Preprint]. 2025 Jan 21:rs.3.rs-5743980. doi: 10.21203/rs.3.rs-5743980/v1. Res Sq. 2025. Update in: Malar J. 2025 Jun 12;24(1):188. doi: 10.1186/s12936-025-05441-3. PMID: 39975885 Free PMC article. Updated. Preprint.
-
Primaquine for reducing Plasmodium falciparum transmission.Cochrane Database Syst Rev. 2012 Sep 12;(9):CD008152. doi: 10.1002/14651858.CD008152.pub2. Cochrane Database Syst Rev. 2012. Update in: Cochrane Database Syst Rev. 2014 Jun 30;(6):CD008152. doi: 10.1002/14651858.CD008152.pub3. PMID: 22972117 Updated.
-
Systemic pharmacological treatments for chronic plaque psoriasis: a network meta-analysis.Cochrane Database Syst Rev. 2021 Apr 19;4(4):CD011535. doi: 10.1002/14651858.CD011535.pub4. Cochrane Database Syst Rev. 2021. Update in: Cochrane Database Syst Rev. 2022 May 23;5:CD011535. doi: 10.1002/14651858.CD011535.pub5. PMID: 33871055 Free PMC article. Updated.
Cited by
-
Artemisinin resistant kelch13 R622I and RDT negativity approaching predominance in northern Ethiopia and emerging C580Y of African origin threaten falciparum malaria control.medRxiv [Preprint]. 2025 Jun 23:2025.06.23.25330019. doi: 10.1101/2025.06.23.25330019. medRxiv. 2025. PMID: 40666313 Free PMC article. Preprint.
-
Rising prevalence of Plasmodium falciparum Artemisinin partial resistance mutations in Ethiopia.Commun Med (Lond). 2025 Jul 18;5(1):297. doi: 10.1038/s43856-025-01008-0. Commun Med (Lond). 2025. PMID: 40681807 Free PMC article.
References
-
- Amambua-Ngwa A., Park D. J., Volkman S. K., Barnes K. G., Bei A. K., Lukens A. K., et al. (2012). SNP genotyping identifies new signatures of selection in a deep sample of West African Plasmodium falciparum malaria parasites. Mol. Biol. Evol. 29 (11), 3249–3253. 10.1093/molbev/mss151 - DOI - PMC - PubMed
-
- Aranda-Díaz A., Vickers E. N., Murie K., Palmer B., Hathaway N., Gerlovina I., et al. (2024). Sensitive and modular amplicon sequencing of Plasmodium falciparum diversity and resistance for research and public health. bioRxiv.org: The Preprint Server for Biology. 10.1101/2024.08.22.609145 - DOI - PMC - PubMed
Grants and funding
LinkOut - more resources
Full Text Sources