A multicenter study on the diagnostic value of ankle brachial index combined with pulse volume wave parameters for peripheral arterial disease
- PMID: 40574820
- PMCID: PMC12198162
- DOI: 10.3389/fcvm.2025.1580971
A multicenter study on the diagnostic value of ankle brachial index combined with pulse volume wave parameters for peripheral arterial disease
Abstract
Objective: To evaluate the significance of incorporating all pulse volume wave parameters, such as the inter-arm systolic blood pressure disparity, inter-leg systolic blood pressure difference, proportion of mean arterial pressure, and upstroke time, into the ankle-brachial index for the detection of peripheral arterial disease.
Methods: This multicenter cross-sectional investigation, conducted across five tertiary medical institutions, enrolled 1,156 participants. Hemodynamic parameters including blood pressure and pulse volume were systematically assessed utilizing an OMRON BP-203RPEIII arterial stiffness analyzer. All four extremities were evaluated in a simultaneous manner under strictly standardized conditions. PAD diagnosis was established by fulfilling one of the predefined criteria: ankle-brachial index (ABI) ≤ 0.9, inter-arm systolic blood pressure disparity (IASBPD) ≥ 10 mmHg, or inter-leg systolic blood pressure divergence (ILSBPD) ≥ 15 mmHg. Diagnostic efficacy was evaluated via receiver operating characteristic curve analysis. Multivariate logistic regression was employed to determine the independent predictive utility of individual or composite parameters.
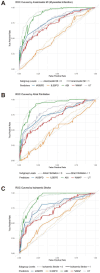
Results: Integrated diagnostic model demonstrated superior discrimination performance in differentiating PAD patients from non-PAD individuals (AUC = 0.924, 95% CI: 0.908-0.940) compared with individual parameters analysis: ABI (AUC = 0.892, 95% CI: 0.872-0.912), ILSBPD (AUC = 0.846, 95% CI: 0.824-0.868), and %MAP (AUC = 0.834, 95% CI: 0.812-0.856). Multivariate logistic regression analysis of all parameters revealed significant independent association with PAD diagnosis. Specifically, ILSBPD exhibited the strongest positive correlation (OR = 1.82, 95% CI: 1.56-2.12, p < 0.001), followed by %MAP (OR = 1.76, 95% CI: 1.48-2.08, p < 0.001). Subgroup analyses identified augmented diagnostic value in patients over 75 years and with diffuse arterial disease. Composite model achieved optimal diagnostic metrics of 88.6% sensitivity and 85.4% specificity.
Conclusions: Integration of ABI with pulse volume wave parameter improved PAD diagnostic accuracy significantly. Quantitative PVR metrics provides objective assessment of peripheral arteries, effectively mitigating limitations of conventional modalities. Automated measurements with predefined thresholds ensure clinical applicability. This approach enhances the clinical utility of a multi-parameter diagnostic strategy applicable across both specialized vascular laboratories and primary care settings, thereby enhancing the precision of PAD detection.
Keywords: ankle-brachial index; arterial stiffness; blood pressure measurement; cardiovascular risk assessment; inter-leg systolic blood pressure difference; peripheral arterial disease; pulse volume recording; vascular diagnosis.
© 2025 Pan, Wang and Huang.
Conflict of interest statement
The authors declare that the research was conducted in the absence of any commercial or financial relationships that could be construed as a potential conflict of interest.
Figures


Similar articles
-
Segmental Pulse Volume Recordings at the Forefoot Level as a Valuable Diagnostic Tool for Detection of Peripheral Arterial Disease in the Diabetic Foot Syndrome.Biomedicines. 2025 May 23;13(6):1281. doi: 10.3390/biomedicines13061281. Biomedicines. 2025. PMID: 40564000 Free PMC article.
-
Simultaneous inter-arm and inter-leg systolic blood pressure differences to diagnose peripheral artery disease: a diagnostic accuracy study.Blood Press. 2018 Apr;27(2):112-119. doi: 10.1080/08037051.2017.1400903. Epub 2017 Nov 10. Blood Press. 2018. PMID: 29124943
-
Diagnostic Test Accuracy of Pedal Acceleration Time to Identify Peripheral Artery Disease.Eur J Vasc Endovasc Surg. 2025 Jun;69(6):876-886. doi: 10.1016/j.ejvs.2025.03.007. Epub 2025 Mar 13. Eur J Vasc Endovasc Surg. 2025. PMID: 40086614
-
Effectiveness of bedside investigations to diagnose peripheral artery disease among people with diabetes mellitus: A systematic review.Diabetes Metab Res Rev. 2024 Mar;40(3):e3683. doi: 10.1002/dmrr.3683. Epub 2023 Jul 21. Diabetes Metab Res Rev. 2024. PMID: 37477087
-
Simultaneously measured inter-arm and inter-leg systolic blood pressure differences and cardiovascular risk stratification: a systemic review and meta-analysis.J Am Soc Hypertens. 2015 Aug;9(8):640-650.e12. doi: 10.1016/j.jash.2015.05.013. Epub 2015 Jun 3. J Am Soc Hypertens. 2015. PMID: 26160261
References
LinkOut - more resources
Full Text Sources
Research Materials

