

Integrated bioinformatics analysis identifies hub genes and immune regulatory networks in HIV infection
- PMID: 40574839
- PMCID: PMC12197935
- DOI: 10.3389/fimmu.2025.1600713
Integrated bioinformatics analysis identifies hub genes and immune regulatory networks in HIV infection
Abstract
Introduction: Acquired Immune Deficiency Syndrome (AIDS) is a chronic and life-threatening condition caused by the human immunodeficiency virus (HIV), which severely weakens the immune system. Despite advances in treatment, AIDS remains incurable. Understanding the molecular mechanisms underlying AIDS progression is crucial for developing effective therapeutic strategies. Therefore, this study aims to identify hub genes associated with AIDS susceptibility and progression, as well as to elucidate potential molecular mechanisms involved.
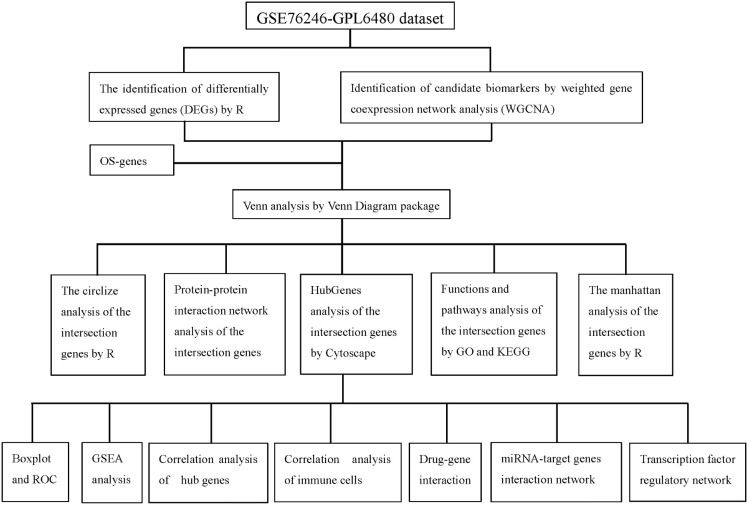
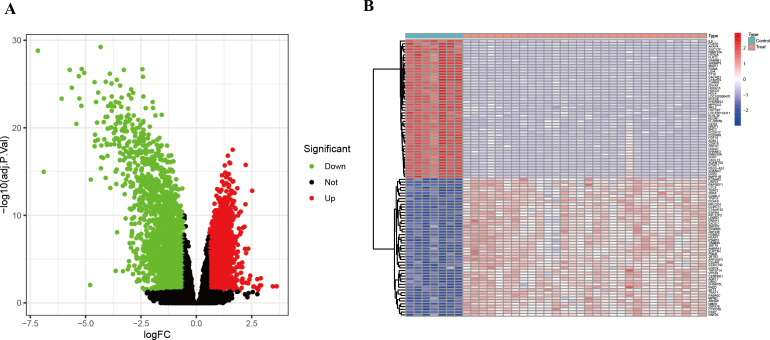
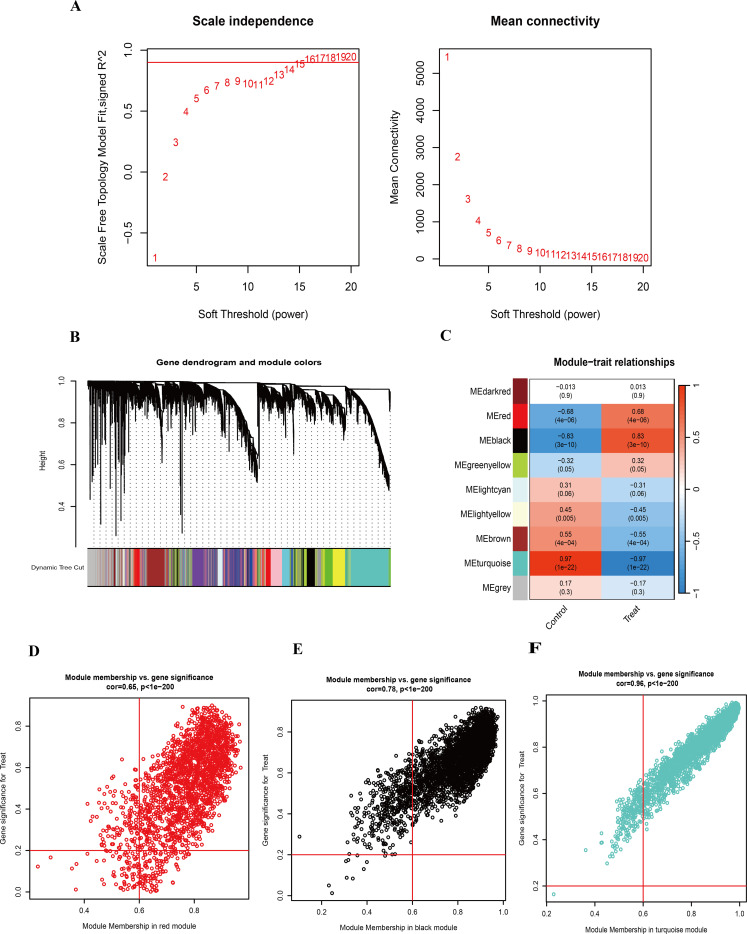
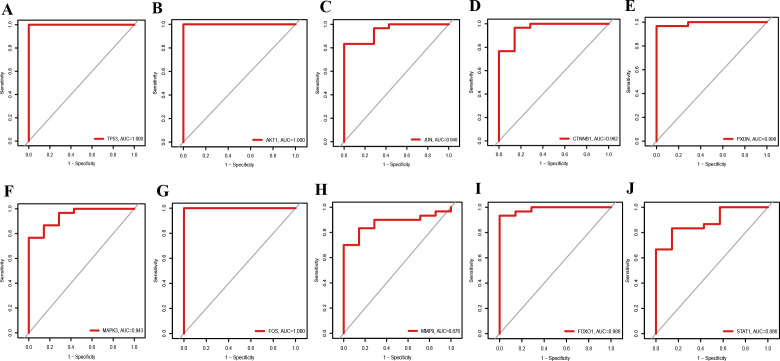
Methods: We used the Gene Expression Omnibus (GEO) dataset GSE76246 for this study. Differentially expressed genes (DEGs) were screened, and Weighted Gene Co-expression Network Analysis (WGCNA) was employed to construct gene modules associated with HIV infection. Hub genes were identified using the CytoHubba plugin, and their expression profiles were assessed using box plots. The diagnostic potential of these genes was evaluated using receiver operating characteristic (ROC) analysis. Functional enrichment and Gene Set Enrichment Analysis (GSEA) were conducted to identify key biological pathways. Additionally, we analyzed immune cell infiltration and constructed drug-gene interaction, miRNA and transcription factor (TF) regulatory networks.
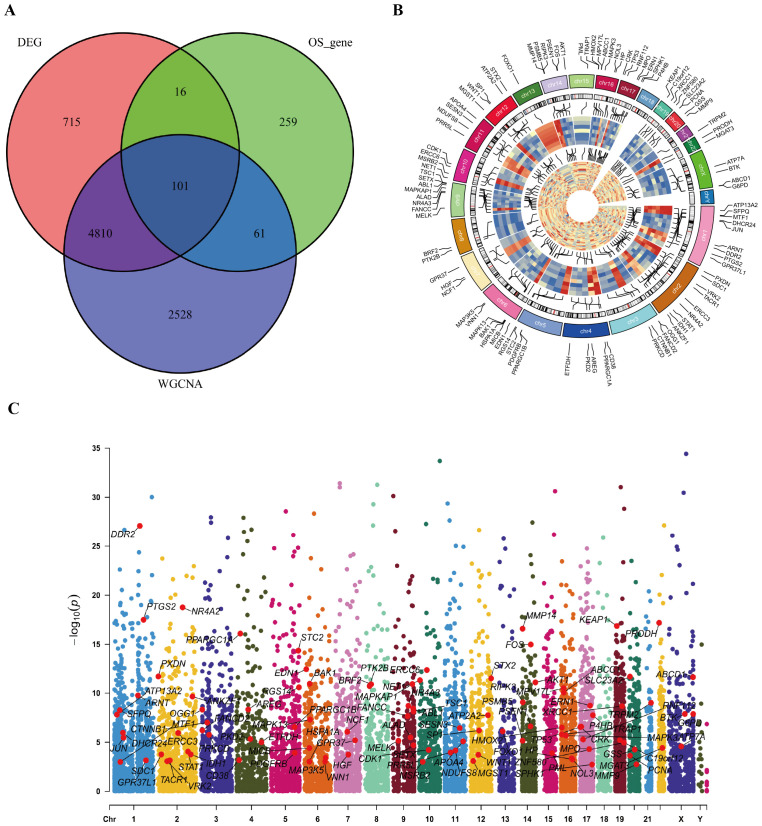
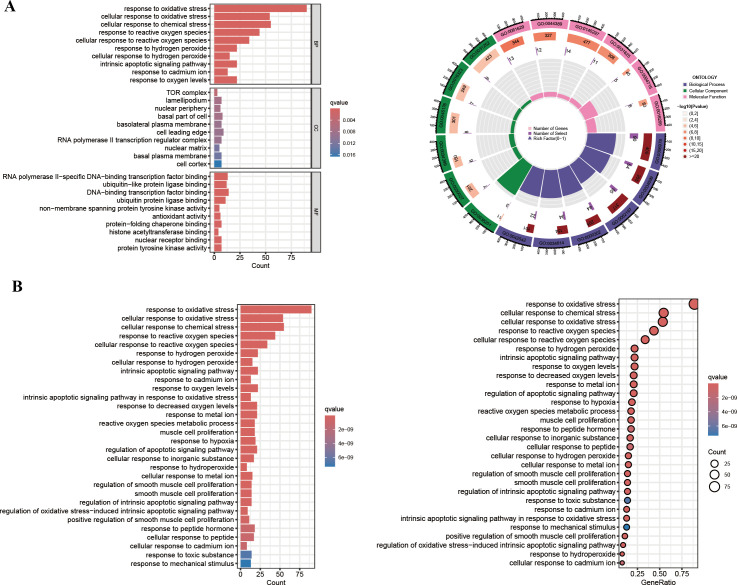
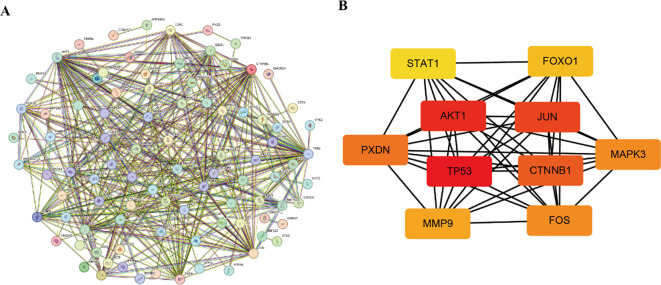
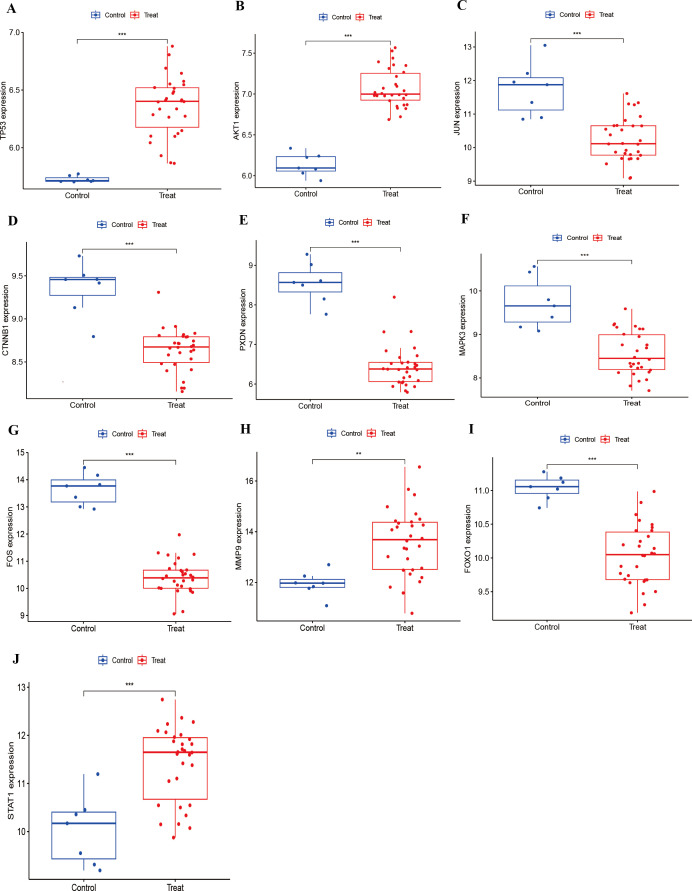
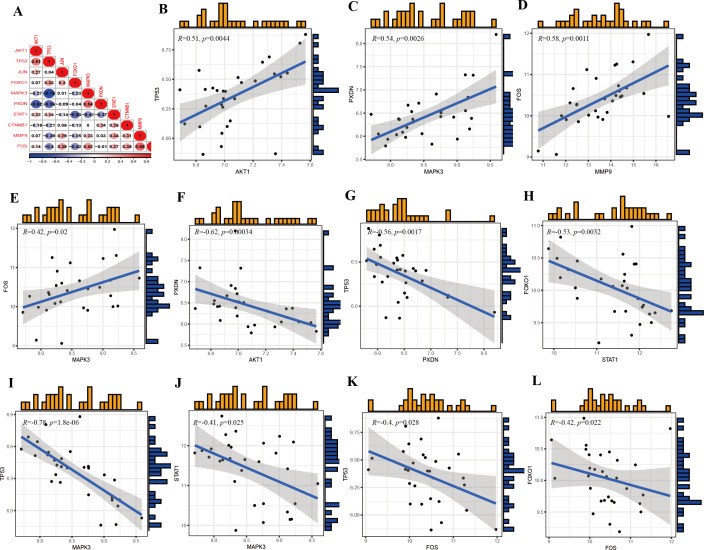
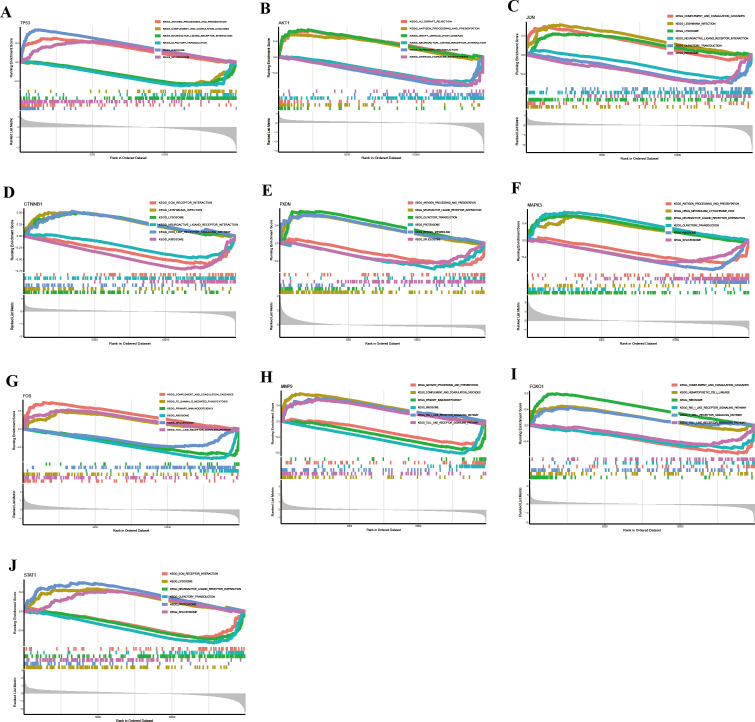
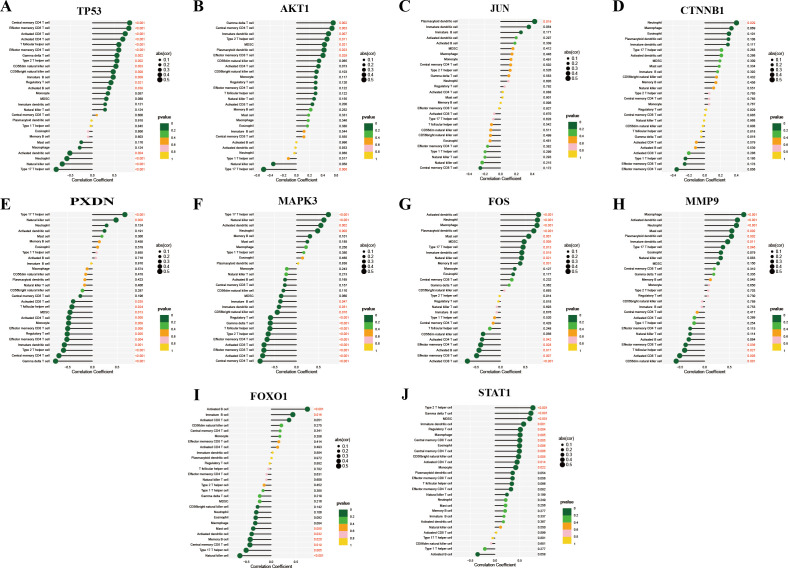
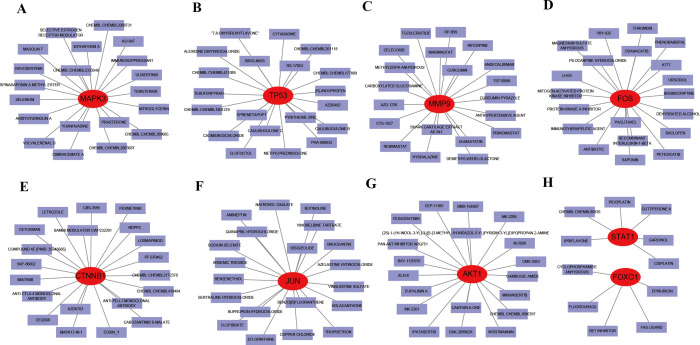
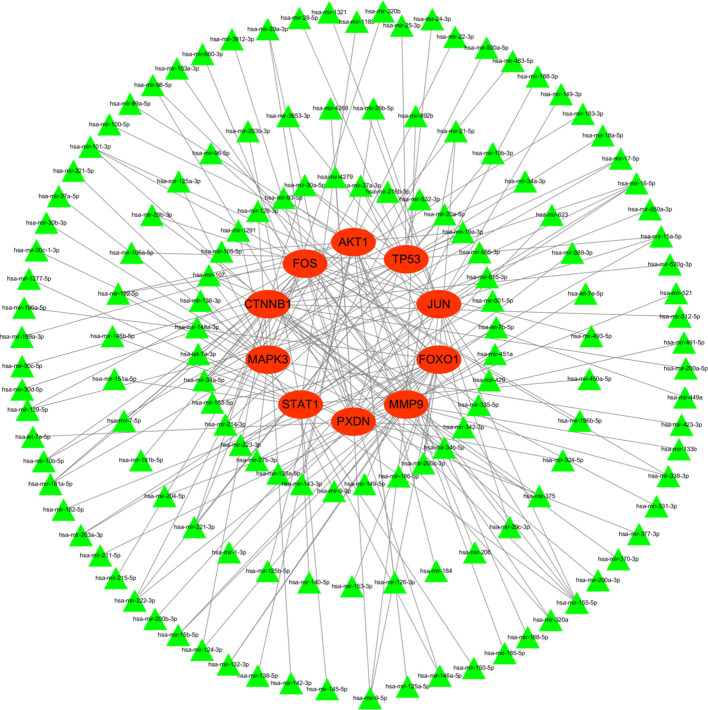
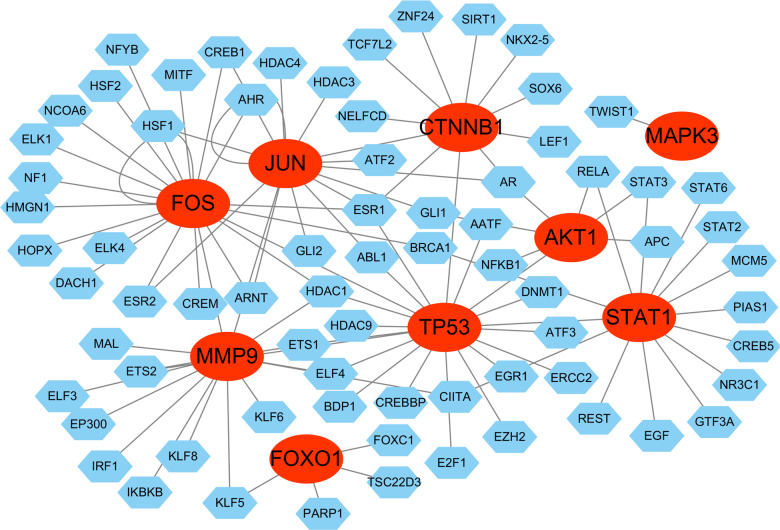
Results: 101 intersection genes were identified by combining DEGs, Oxidative stress genes and module genes from WGCNA. Functional enrichment analysis highlighted key pathways, including oxidative stress response and apoptotic signaling. A protein-protein interaction (PPI) network analysis identified 10 hub genes (TP53, AKT1, JUN, CTNNB1, PXDN, MAPK3, FOS, MMP9, FOXO1, STAT1), which showed strong diagnostic potential, as evidenced by ROC curve analysis. Immune infiltration analysis revealed significant associations between hub genes and various immune cell populations. Furthermore, drug-gene interaction analysis predicted several potential therapeutic compounds. Additionally, miRNA and TF regulatory networks were constructed, identifying critical regulatory elements influencing the expression of hub genes.
Conclusion: This study identified ten hub genes (TP53, AKT1, JUN, CTNNB1, PXDN, MAPK3, FOS, MMP9, FOXO1, STAT1) that play crucial roles in HIV infection and progression. These genes serve as potential biomarkers for HIV diagnosis and therapeutic targets.
Keywords: HIV infection; bioinformatics analysis; hub genes; immune; regulatory networks.
Copyright © 2025 Pang, Chen, Jing, Shi, Chen, Huang and Liu.
Conflict of interest statement
The authors declare that the research was conducted in the absence of any commercial or financial relationships that could be construed as a potential conflict of interest.
Figures
Similar articles
-
Deciphering Shared Gene Signatures and Immune Infiltration Characteristics Between Gestational Diabetes Mellitus and Preeclampsia by Integrated Bioinformatics Analysis and Machine Learning.Reprod Sci. 2025 Jun;32(6):1886-1904. doi: 10.1007/s43032-025-01847-1. Epub 2025 May 15. Reprod Sci. 2025. PMID: 40374866
-
Transcriptomics explores potential mechanisms for the development of Primary Sjogren's syndrome to diffuse large B-cell lymphoma in B cells.BMC Immunol. 2024 Jul 30;25(1):53. doi: 10.1186/s12865-024-00646-8. BMC Immunol. 2024. PMID: 39080525 Free PMC article.
-
Identifying pyroptosis- and inflammation-related genes in spinal cord injury based on bioinformatics analysis.Sci Rep. 2025 Jul 14;15(1):25424. doi: 10.1038/s41598-025-10541-w. Sci Rep. 2025. PMID: 40659785 Free PMC article.
-
Systemic pharmacological treatments for chronic plaque psoriasis: a network meta-analysis.Cochrane Database Syst Rev. 2021 Apr 19;4(4):CD011535. doi: 10.1002/14651858.CD011535.pub4. Cochrane Database Syst Rev. 2021. Update in: Cochrane Database Syst Rev. 2022 May 23;5:CD011535. doi: 10.1002/14651858.CD011535.pub5. PMID: 33871055 Free PMC article. Updated.
-
Identifying Biomarkers for Atherosclerosis via Gene Expression and Biological Networking.Curr Cardiol Rev. 2025;21(3):e1573403X340118. doi: 10.2174/011573403X340118241113025519. Curr Cardiol Rev. 2025. PMID: 39773060 Review.
References
-
- UNAIDS 2024 epidemiological estimates . UNAIDS financial estimates (2024). Available online at: http://hivfinancial.unaids.org/hivfinancialdashboards.html (Accessed August 2, 2024).
MeSH terms
Substances
LinkOut - more resources
Full Text Sources
Medical
Research Materials
Miscellaneous