. 2025 Jun 12:16:1553963.
doi: 10.3389/fimmu.2025.1553963. eCollection 2025.

Single cell dissection reveals SFRP2+ fibroblasts amplifying inflammatory responses in oral lichen planus

Affiliations

Single cell dissection reveals SFRP2+ fibroblasts amplifying inflammatory responses in oral lichen planus

Juehua Cheng et al. Front Immunol. .

Abstract

Objectives: Oral lichen planus (OLP) is a chronic inflammatory mucosal disease with an incompletely understood pathogenesis. This study aimed to investigate the role of disease-specific fibroblasts in OLP.

Methods: We performed single-cell RNA sequencing on buccal mucosa of 4 OLP patients and one healthy control. Additionally, mRNA expression and immunofluorescence staining were analyzed in primary fibroblasts from 51 OLP patients and 24 healthy individuals. The spatial cellular interactions were assessed using multiplex immunofluorescences in OLP tissues.

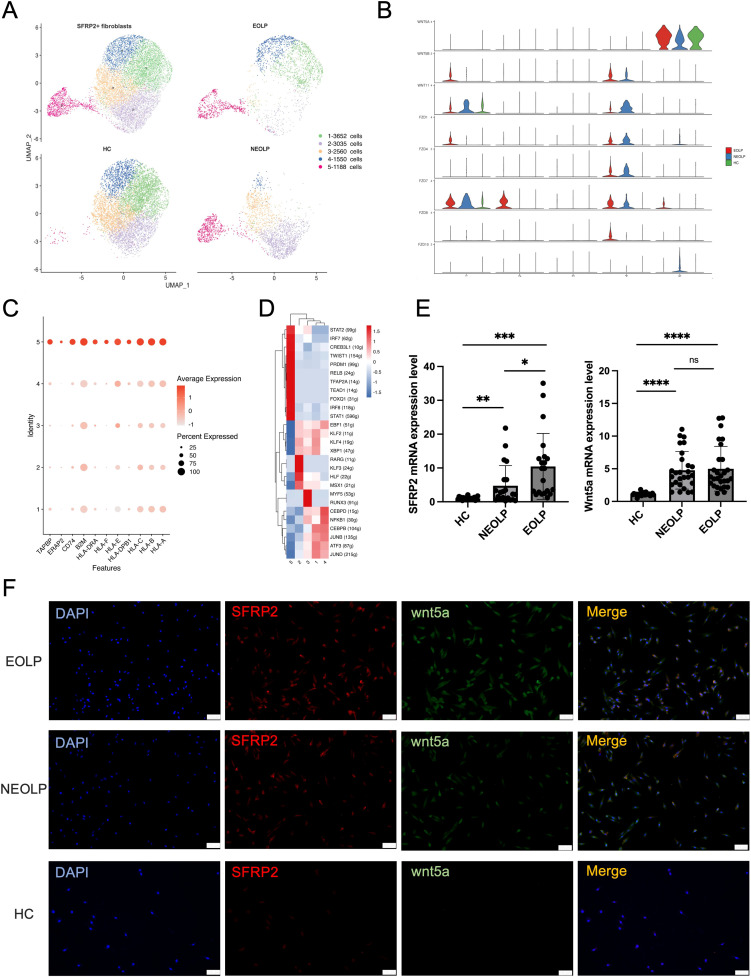
Results: Using single-cell RNA sequencing, we identified SFRP2+ fibroblasts as the origin of inflammatory fibroblasts in OLP. A subset of SFRP2+ fibroblasts specifically expressed Wnt5a and was implicated in antigen processing and presentation pathway in OLP. Furthermore, SFRP2+Wnt5a+ fibroblasts amplified and maintained the local immune inflammation by interacting with CD8+ T cells and epithelial cells. Compared to the healthy control group, upregulated expressions of pro-inflammatory molecules (CXCL12, CXCL14) and antigen presenting associated molecules (HLA-A, HLA-B, HLA-C and ERAP2) were displayed in OLP group at mRNA level. Colocalization of SFRP2 and Wnt5a was displayed in the primary cultured fibroblasts of OLP in vitro. Besides, SFRP2+ Wnt5a+ fibroblasts were located around CD8+ T cells in the superficial layer of the lymphocyte infiltration zone.

Conclusions: Our findings reveal the heterogeneity and pathogenic mechanisms of fibroblasts in OLP, providing new insights into the cellular drivers of chronic inflammation in OLP.

Keywords: SFRP2; antigen processing and presenting; fibroblasts; oral lichen planus; single-cell sequencing.


Conflict of interest statement

The authors declare that the research was conducted in the absence of any commercial or financial relationships that could be construed as a potential conflict of interest.

Figures

Figure 1
Figure 1
scRNA-seq profiling of the cell composition from healthy control, NEOLP and EOLP tissue samples. (A) The uniform manifold approximation and projection (UMAP) of the 76,657 cells profiled here showing cells colored by 15 sub-populations. (B) Bar plot showing the 10 cell types colored by disease conditions, originating from HC, NEOLP and EOLP group. (C) Dot plot analysis showing representative marker genes for each cell type. The color scale represents the scaled expression of each gene. (D) UMAP plot displaying cells categorized by T cell types. (E) Bar plot showing the different compositions of T cell types across HC, NEOLP and EOLP group.
Figure 2
Figure 2
Fibroblasts involved in immunity disorder of OLP by secreting pro-inflammatory factors. (A) UMAP plot showing 33,762 fibroblasts colored by 5 sub-clusters. (B) UMAP plot showing fibroblasts colored by diverse disease conditions. (C) Compared to HC group, heatmap showing the top 20 up-regulated and down-regulated genes in NEOLP and EOLP. (D) Dot plot analysis of highly expressed pro-inflammatory factors across 5 subclusters of fibroblasts types. The color scale represents the scaled expression of each gene. (E, F). Dot plot of KEGG enrichment analysis showing the DEGs of fibroblasts between NEOLP and HC, EOLP and HC.
Figure 3
Figure 3
SFRP2+ Wnt5a+ fibroblasts were specific contributor of OLP immunological responses. (A) UMAP plot showing SFRP2+ fibroblasts colored into 5 differential cell types, and colored by diverse disease conditions. (B) Violin plot showing the expression of gene split by subcluster of SFRP2+ fibroblasts. (C) Dot plot showing the expression of antigen presenting associated genes in each subcluster of SFRP2+ fibroblasts. The color scale represents the scaled expression of each gene. (D) Heatmap showing up-regulated regulon activity across 5 different SFRP2+ fibroblasts subtypes. (E) mRNA expression of SFRP2 and Wnt5a in primary cultured fibroblasts. *p< 0.05, *p< 0.01, ***p< 0.001, ****p< 0. 0001, ns, not significant. (HC, n=24; NEOLP, n=25; EOLP, n=26) (F) Immunofluorescence of primary cultured fibroblasts, SFRP2 (red), Wnt5a (green), Merge (yellow). Scale bar:100μm. **p<0.01.
Figure 4
Figure 4
Distinct SFRP2+ fibroblasts states reflect immunology responses in OLP. (A. B) Pseudotime trajectory of SFRP2+ fibroblasts arranged along the disease state of OLP (A) and the chronological order (B). (C) Pseudotime trajectory of SFRP2+ fibroblasts annotated diverse cell types along chronological order. (D-I) Pseudotime gene expression of antigen-presenting molecules in SFRP2+ fibroblasts along the chronological order. (J) GO analysis of DEGs in SFRP2+ fibroblasts.
Figure 5
Figure 5
Phenotypic changes of keratinocytes with different differentiation states under inflammatory conditions in OLP. (A) UMAP plot showing epithelial cells colored by 3 cell types. (B, C) Dot plot of KEGG enrichment analysis of DEGs between NEOLP and HC, EOLP and HC in epithelial cells. (D) Dot plot analysis of top 10 differential expressed genes comparing HC to NEOLP and EOLP in the basal (left), spinous (middle), and supraspinous (right) layers. The color scale represents the scaled expression of each gene. (E) Immunohistochemistry showing the expression of cytokeratin17 in the epithelial layer of HC, NEOLP and EOLP tissue. Scale bar:200 pixels.
Figure 6
Figure 6
Cell-to-cell communication analysis of specific network among SFRP2+ fibroblasts, CD8+ T cells and epithelial cells in OLP. (A, B) Heatmap showing the differential interaction strength between the NEOLP and HC, EOLP and HC of the 5 subclusters of SFRP2+ fibroblasts, subclusters of epithelial cells (basal, spinous and supraspinous) and subclusters of T cells. (C) The mIHC staining of SFRP2 (red), Wnt5a (white), CD8 (pink) and Vimentin (green) in the samples of OLP buccal mucosa. Scale bars= 200μm. (D) The mIHC staining of SFRP2 (red), Wnt5a (white) and Vimentin (green)in the samples of OLP buccal mucosa. Scale bars=50μm. (E) The mIHC staining of SFRP2 (red), CD8 (pink) and Vimentin (green) in the samples of OLP buccal mucosa. Scale bars=50μm. (F-H). Heatmap showing the MHC-I signaling interaction strength between T cells, fibroblasts and epithelial cells at NEOLP, EOLP and HC stages.

Similar articles

References

    1. Li C, Tang X, Zheng X, Ge S, Wen H, Lin X, et al. Global prevalence and incidence estimates of oral lichen planus: A systematic review and meta-analysis. JAMA Dermatol. (2020) 156:172–81. doi: 10.1001/jamadermatol.2019.3797 - DOI - PMC - PubMed
    1. Louisy A, Humbert E, Samimi M. Oral lichen planus: an update on diagnosis and management. Am J Clin Dermatol. (2024) 25:35–53. doi: 10.1007/s40257-023-00814-3 - DOI - PubMed
    1. El-Howati A, Thornhill MH, Colley HE, Murdoch C. Immune mechanisms in oral lichen planus. Oral Dis. (2023) 29:1400–15. doi: 10.1111/odi.14142 - DOI - PubMed
    1. Buechler MB, Pradhan RN, Krishnamurty AT, Cox C, Calviello AK, Wang AW, et al. Cross-tissue organization of the fibroblast lineage. Nature. (2021) 593:575–9. doi: 10.1038/s41586-021-03549-5 - DOI - PubMed
    1. Xu Z, Chen D, Hu Y, Jiang K, Huang H, Du Y, et al. Anatomically distinct fibroblast subsets determine skin autoimmune patterns. Nature. (2022) 601:118–24. doi: 10.1038/s41586-021-04221-8 - DOI - PubMed

MeSH terms

LinkOut - more resources