. 2025 Jun 12:15:1597585.
doi: 10.3389/fonc.2025.1597585. eCollection 2025.

Lung cancer-associated fibroblasts-mediated collagen deposition drives mediastinal lymph node metastasis in non-small cell lung cancer

Affiliations

Lung cancer-associated fibroblasts-mediated collagen deposition drives mediastinal lymph node metastasis in non-small cell lung cancer

Caoyang Chen et al. Front Oncol. .

Abstract

Introduction: Metastasis to mediastinal lymph nodes signifies an advanced stage of non-small cell lung cancer (NSCLC) and presents significant clinical challenges. Cancer-associated fibroblasts (CAFs) within the tumor microenvironment (TME) play a crucial role in tumor progression by promoting growth and invasion. However, the specific contributions of lung CAFs to mediastinal lymph node metastasis in NSCLC remain poorly understood. Moreover, no therapeutics currently target CAFs to combat mediastinal lymph node metastasis in NSCLC. This study aims to elucidate the precise roles of CAFs in these complex processes and to investigate innovative therapeutic strategies that target CAFs to suppress metastasis to mediastinal lymph nodes.

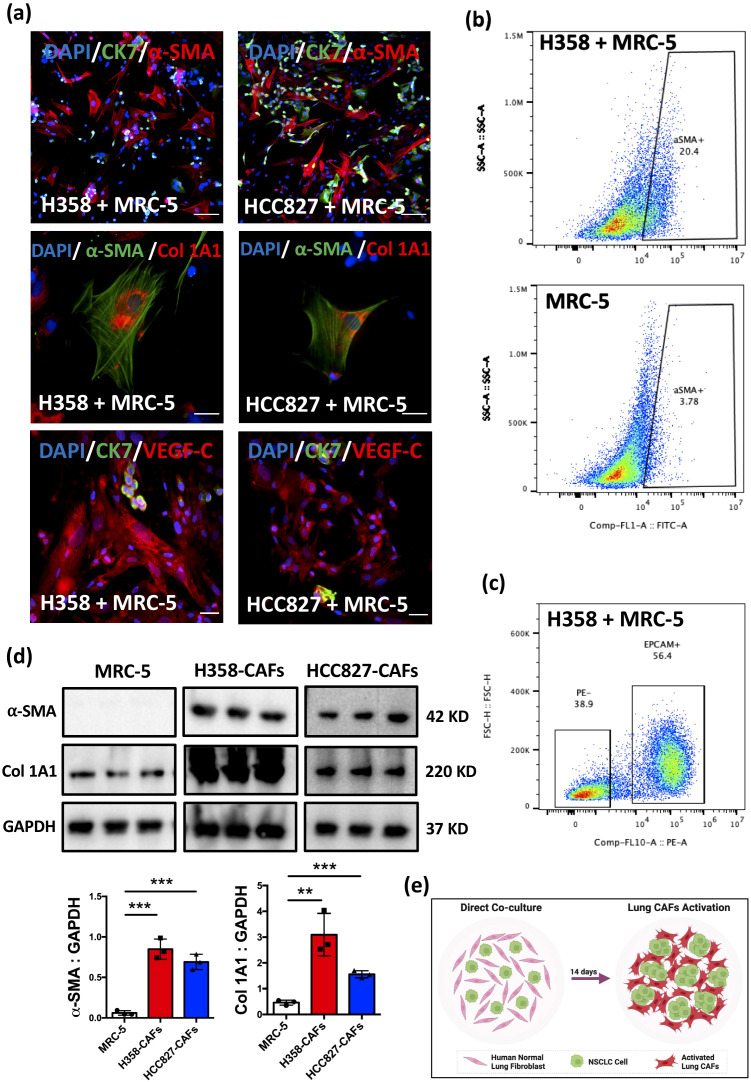
Methods: Normal human lung fibroblasts (MRC-5) were directly co-cultured with NSCLC cell lines (H358 and HCC827) to generate lung CAFs. These activated CAFs were identified using immunofluorescence, flow cytometry, and Western blotting. To model human mediastinal lymph node metastasis, orthotopic xenograft (OX) models were established by intrathoracically injecting NSCLC cells into the left lung of mice, either alone or in combination with lung CAFs. The viability of cancer cells and lung CAFs post-treatment with ABT-199, a Bcl-2 inhibitor, was evaluated using MTT assays. The therapeutic efficacy of ABT-199 was further assessed through oral gavage in OX models, focusing on its potential to prevent metastasis to mediastinal lymph nodes. Tumor growth was monitored longitudinally using micro-computed tomography (CT), and treatment response was evaluated in accordance with RECIST 1.1 criteria. Primary tumors and mediastinal lymph node metastases were analyzed using hematoxylin and eosin (H&E) staining for general morphology, supplemented by immunohistochemistry/immunofluorescence to detect specific protein markers. Fibrillar collagen deposition within the TME was quantified using picrosirius red staining (PRS).

Results: Activation of α-SMA, accompanied by a significant increase in Col 1A1 expression in MRC-5 cells, was successfully induced through a direct 14-day co-culture with NSCLC cell lines. Histological analysis revealed increased fibrotic tissue formation, enhanced fibrillar collagen deposition, peritumoral lymphangiogenesis, and mediastinal lymph node metastasis in CAFs-enriched orthotopic xenograft (OX) tumors compared to CAFs-devoid OX tumors. The viability of lung CAFs was dose-dependently inhibited by ABT-199 in vitro. A two-week treatment with ABT-199 (100mg/kg) led to a significant reduction in lung CAFs and lymphangiogenesis in the CAFs-enriched OX model. Furthermore, an eight-week treatment with ABT-199 (100mg/kg) significantly reduced fibrillar collagen deposition and inhibited the number of metastases to mediastinal lymph nodes in both CAFs-devoid and CAFs-enriched OX models.

Conclusions: In NSCLC, cancer cells induce the differentiation of resident normal lung fibroblasts into lung CAFs. These CAFs secrete excessive collagens within the TME, thereby promoting tumor lymphangiogenesis and facilitating metastasis to mediastinal lymph nodes. Our findings, based on modified OX models, suggest that targeting lung CAFs could effectively attenuate lymphatic dissemination in NSCLC.

Keywords: NSCLC; cancer-associated fibroblasts; lymphangiogenesis; mediastinal lymph node metastasis; orthotopic xenograft model.


Conflict of interest statement

The authors declare that the research was conducted in the absence of any commercial or financial relationships that could be construed as a potential conflict of interest. The author(s) declared that they were an editorial board member of Frontiers, at the time of submission. This had no impact on the peer review process and the final decision.

Figures

Figure 1
Figure 1
Induction of phenotypic and functional activation in lung CAFs through direct co-culture. (a) Representative IF images of staining for α-SMA, CK7, Col 1A1, VEGF-C in MRC-5 cells after co-culture with H358/HCC827 cells for 14 days. DAPI (blue) was used to stain nuclei. Scale bars: 100 μm. (b) Representative flow cytometry images showing the percentage of α-SMA+ fibroblasts in MRC-5 and H358 + MRC-5 (co-cultured for 14 days). (c) Representative flow cytometry images of cell sorting. EPCAM was used to stain cancer cells. (d) α-SMA and Col 1A1 expression in MRC-5, H358-CAFs, and HCC827-CAFs assessed by Western blot. GAPDH served as a loading control. Quantification of α-SMA expression in MRC-5 cells (Mean ± SEM: 0.06 ± 0.01, n=3) compared with H358-CAFs (Mean ± SEM: 0.84 ± 0.07, n=3) and HCC827-CAFs (Mean ± SEM: 0.69 ± 0.05, n=3). Quantification of Col 1A1 expression in MRC-5 cells (Mean ± SEM: 0.46 ± 0.05, n=3) compared with H358-CAFs (Mean ± SEM: 3.09 ± 0.47, n=3) and HCC827-CAFs (Mean ± SEM: 1.55 ± 0.08, n=3). (e) Graphic illustration of the direct co-culture system (Figure created in BioRender.com). P values were assessed by unpaired, two-tailed Student’s t-test and one-way ANOVA. (**p <0.01, ***p <0.001).
Figure 2
Figure 2
Lung CAFs contribute to desmoplasia and lymphangiogenesis in NSCLC. (a) Graphic illustration of intrathoracic injection. (Figure created in BioRender.com). (b) Representative IF images of cancer cells (CK7+, green) and activated lung CAFs (α-SMA+, red). DAPI (blue) was used to stain nuclei. Scale bars: 100 μm. (c) Representative photographs of harvested whole left lung with tumour (orthotopic xenografts). (d) Representative IHC images of H358/H358 + CAFs orthotopic xenografts stained with α-SMA (brown). Scale bars: 100 μm. Representative IF images of H358-CAFs-added orthotopic xenografts stained with α-SMA (green) and VEGF-C (red) antibodies. DAPI (blue) was used to stain nuclei. Scale bars: 100 μm. (e) Representative IF images of orthotopic xenografts stained with α-SMA (red) and lyve-1 (green) antibodies. DAPI (blue) was used to stain nuclei. Scale bars: 100 μm. Quantification of lyve-1 expression area in H358 + CAFs orthotopic xenografts (Mean ± SEM: 1.08 ± 0.13, n=5) compared with H358 only orthotopic xenografts (Mean ± SEM: 0.25 ± 0.01, n=5). (f) Representative H&E-stained images of orthotopic xenografts (H358, H358 + MRC-5, and H358 + CAFs), collected 2 weeks post-inoculation. (g) Representative PRS (red) images of orthotopic xenografts. Scale bars: 100 μm. Quantification of fibrillar collagen deposition area in H358 + CAFs orthotopic xenografts (Mean ± SEM: 33.88 ± 4.74, n=3) compared with H358 only orthotopic xenografts (Mean ± SEM: 3.420 ± 0.72, n=3). Quantification of collagen deposition area in H358 + CAFs orthotopic xenografts (Mean ± SEM: 33.88 ± 4.74, n=3) compared with H358 + MRC-5 orthotopic xenografts (Mean ± SEM: 7.953 ± 0.53, n=3). Quantification of collagen deposition area in H358 + MRC-5 orthotopic xenografts (Mean ± SEM: 7.953 ± 0.53, n=3) compared with H358 only orthotopic xenografts (Mean ± SEM: 3.420 ± 0.72, n=3). (h) Representative IF images of orthotopic xenografts stained with Ki-67 (red) and α-SMA (green) antibodies. DAPI (blue) was used to stain nuclei. Scale bars: 100 μm. Quantification of α-SMA expression area in H358 + CAFs orthotopic xenografts (Mean ± SEM: 17.49 ± 0.77, n=3) compared with H358 only orthotopic xenografts (Mean ± SEM: 4.54 ± 0.23, n=3). Quantification of α-SMA expression area in H358 + CAFs orthotopic xenografts (Mean ± SEM: 17.49 ± 0.77, n=3) compared with H358 + MRC-5 orthotopic xenografts (Mean ± SEM: 9.32 ± 1.29, n=3). Quantification of α-SMA expression area in H358 + MRC-5 orthotopic xenografts (Mean ± SEM: 9.323 ± 1.29, n=3) compared with H358 only orthotopic xenografts (Mean ± SEM: 4.54 ± 0.23, n=3). (i) Representative IF images of orthotopic xenografts stained with Ki-67 (red) and CK7 (green) antibodies. DAPI (blue) was used to stain nuclei. Scale bars: 100 μm. Quantification of Ki-67+CK7+ index in H358 + CAFs orthotopic xenografts (Mean ± SEM: 21.07 ± 0.58, n=3) compared with H358 only orthotopic xenografts (Mean ± SEM: 16.34 ± 0.59, n=3). Quantification of Ki-67+CK7+ index in H358 + CAFs orthotopic xenografts (Mean ± SEM: 21.07 ± 0.58, n=3) compared with H358 + MRC-5 orthotopic xenografts (Mean ± SEM: 15.20 ± 0.33, n=3). Quantification of Ki-67+CK7+ index in H358 + MRC-5 orthotopic xenografts (Mean ± SEM: 15.20 ± 0.33, n=3) compared with H358 only orthotopic xenografts (Mean ± SEM: 16.34 ± 0.59, n=3). P values were assessed by unpaired, two-tailed Student’s t-test and one-way ANOVA. (n.s.: not significant, *p < 0.05, **p < 0.01, ***p < 0.001, ****p < 0.0001).
Figure 3
Figure 3
Lung CAFs facilitate mediastinal lymph node metastasis in NSCLC. (a) Graphic illustration of intrathoracic injection and flow chart of the experiment. (Figure created in BioRender.com). (b) Representative images of weekly micro-CT. Arrows (in red) indicate tumour formation and growth in the left lung of mice. (c) Representative IHC/IF images of primary tumour (pT) stained with CK7 (brown), α-SMA (red) and lyve-1 (green) antibodies. Arrows (in white) indicates lymphatic vessels. Hematoxylin (blue) and DAPI (blue) were used to stain nuclei. Scale bars: 100 μm. Quantification of α-SMA+ area in H358 + CAFs orthotopic xenografts (Mean ± SEM: 2.95 ± 0.41, n=5) compared with H358 only orthotopic xenografts (Mean ± SEM: 0.91 ± 0.18, n=5). Quantification of lyve-1+ area in H358 + CAFs orthotopic xenografts (Mean ± SEM: 1.53 ± 0.14, n=5) compared with H358 only orthotopic xenografts (Mean ± SEM: 0.62 ± 0.12, n=5). (d) Representative IHC/IF images of mediastinal lymph node metastasis (LNM) stained with CK7 (brown), α-SMA (red) and lyve-1 (green) antibodies. Hematoxylin (blue) and DAPI (blue) were used to stain nuclei. Scale bars: 100 μm. Arrows (blue) indicates LNM. (e) Representative photographs of harvested whole lungs and mediastinum. Representative whole tissue scan images of H&E staining. Dotted line (in yellow) indicates pT. Arrows (in blue) indicates LNM. Quantification of mediastinal lymph node metastases in H358 + CAFs orthotopic xenografts (Mean ± SEM: 4.0 ± 0.56, n=5) compared with H358 only orthotopic xenografts (Mean ± SEM: 1.60 ± 0.25, n=5). P values were assessed by unpaired, two-tailed Student’s t-test. (**p <0.01).
Figure 4
Figure 4
Elimination of lung CAFs by ABT-199 in vitro. (a) Cell viability (MTT assay, biological triplicates) of cell lines (H358, HCC827, MRC-5) and H358-CAFs and HCC827-CAFs treated with ABT-199 (0-40 μM) for 24 hours. (b) Graphic illustration of apoptosis in activated lung CAFs by ABT-199 (Figure created in BioRender.com). (c) Representative light microscopic images of H358 + CAFs and HCC827 + CAFs after treatment with DMSO or ABT-199 (20 μM) for 24 hours. (d) Representative flow cytometry images showing the percentage of α-SMA+PB450+ fibroblasts (apoptotic lung CAFs) after treatment with ABT-199 (20 μM) for 24 hours in H358 + CAFs and HCC827 + CAFs compared to treatment with DMSO. Quantification of the percentage of α-SMA+PB450+ fibroblasts after treatment with ABT-199 (20 μM) (Mean ± SEM: 16.87 ± 1.40, n=3) for 24 hours in H358 + CAFs compared to treatment with DMSO (Mean ± SEM: 4.40 ± 0.15, n=3); Quantification of the percentage of α-SMA+PB450+ fibroblasts after treatment with ABT-199 (20 μM) (Mean ± SEM: 11.27 ± 0.76, n=3) for 24 hours in HCC827 + CAFs compared to treatment with DMSO (Mean ± SEM: 7.46 ± 0.26, n=3). (e) Representative immunofluorescence images of MRC-5 cells stained with Ki-67 (red) antibody after treatment with ABT-199 (20 μM) (Mean ± SEM: 55.97 ± 1.411, n=3) compared to treatment with DMSO (Mean ± SEM: 56.90 ± 2.128, n=3) for 24 hours. DAPI (blue) was used to stain nuclei. Scale bars: 100 μm. P values were assessed by unpaired, two-tailed Student’s t-test. (n.s., not significant, **p < 0.01, ***p < 0.001).
Figure 5
Figure 5
Suppression of tumour growth and lymphangiogenesis by ABT-199 in vivo. (a) Graphic illustration of intrathoracic injection and experimental flowchart (Figure created in BioRender.com). (b) Representative images of weekly micro-CT scans. Red arrows indicate tumour formation and growth in the left lung of mice. Quantification of the maximal diameter of H358 + CAFs orthotopic xenografts treated with ABT-199 (100 mg/kg) (Mean ± SEM: 4.13 ± 0.2, n=5) compared with the vehicle group (Mean ± SEM: 5.03 ± 0.26, n=5). (c) Representative IHC images of orthotopic xenografts stained with the Ki-67 antibody. Hematoxylin (blue) was used to stain nuclei. Scale bars: 100 μm. Quantification of the Ki-67 index in H358 + CAFs orthotopic xenografts treated with ABT-199 (100 mg/kg) (Mean ± SEM: 22.86 ± 2.12, n=5) compared with the vehicle group (Mean ± SEM: 40.26 ± 1.90, n=5). (d) Representative immunofluorescence images of orthotopic xenografts stained with α-SMA (red) and lyve-1 (green) antibodies. DAPI (blue) was used to stain nuclei. Scale bars: 100 μm. Quantification of the α-SMA+ area in H358 + CAFs orthotopic xenografts treated with ABT-199 (100 mg/kg) (Mean ± SEM: 1.53 ± 0.19, n=5) compared with the vehicle group (Mean ± SEM: 2.85 ± 0.49, n=5). Quantification of the lyve-1+ area in H358 + CAFs orthotopic xenografts treated with ABT-199 (100 mg/kg) (Mean ± SEM: 0.31 ± 0.07, n=5) compared with the vehicle group (Mean ± SEM: 1.40 ± 0.24, n=5). (e) Representative IHC images of orthotopic xenografts stained with the VEGF-C antibody. Hematoxylin (blue) was used to stain nuclei. Scale bars: 100 μm. P values were assessed by unpaired, two-tailed Student’s t-test (*p < 0.05, **p < 0.01, ***p < 0.001).
Figure 6
Figure 6
Inhibition of mediastinal lymph node metastasis by ABT-199 in vivo. (a) Flow chart of the treatment of ABT-199 in H358 + CAFs and H358-only OX models (Figure created in BioRender.com). (b) Representative images of weekly micro-CT. Quantification of maximal diameter of the H358 + CAFs orthotopic xenografts treated with ABT-199 (100mg/kg) group (Week 5: Mean ± SEM: 4.67 ± 0.28, n=12; Week 6: Mean ± SEM: 5.14 ± 0.25 n=12; Week 8: Mean ± SEM: 5.88 ± 0.28, n=12) compared with vehicle group (Week 5: Mean ± SEM: 5.44 ± 0.20, n=11; Week 6: Mean ± SEM: 5.95 ± 0.20,n=11; Week 8: Mean ± SEM: 7.16 ± 0.32, n=11). Quantification of maximal diameter of the H358-only orthotopic xenografts treated with ABT-199 (100mg/kg) group (Week 8: Mean ± SEM: 5.56 ± 0.18 n=11) compared with vehicle group (Week 8: Mean ± SEM: 6.03 ± 0.35 n=10). (c) Representative IF images of H358 + CAFs and H358-only orthotopic xenografts stained with Ki-67 (red) and CK7 (green) antibodies. Quantification of Ki-67+CK7+ index of H358 + CAFs orthotopic xenografts treated with ABT-199 (100mg/kg) group (Mean ± SEM: 23.01 ± 2.14, n=12) compared with vehicle group (Mean ± SEM: 25.21 ± 1.80, n=11). DAPI (blue) was used to stain nuclei. Scale bars: 100 μm. Quantification of Ki-67+CK7+ index of H358-only orthotopic xenografts treated with ABT-199 (100mg/kg) group (Mean ± SEM: 19.53 ± 1.02 n=11) compared with vehicle group (Mean ± SEM: 18.91 ± 1.71 n=10). DAPI (blue) was used to stain nuclei. Scale bars: 100 μm. (d) Representative PRS (red) images of H358 + CAFs and H358-only orthotopic xenografts. Scale bars: 100 μm. Quantification of fibrillar collagen deposition area index of H358 + CAFs orthotopic xenografts treated with ABT-199 (100mg/kg) group (Mean ± SEM: 5.05 ± 0.78, n=12) compared with the vehicle group (Mean ± SEM: 16.75 ± 0.74, n=11). Quantification of fibrillar collagen deposition area index of H358-only orthotopic xenografts treated with ABT-199 (100mg/kg) group (Mean ± SEM: 4.71 ± 0.35, n=11) compared with the vehicle group (Mean ± SEM: 8.33 ± 0.51, n=10). (e) Representative IF images stained with Ki-67 (red) and α-SMA (green) antibodies. Quantification of α-SMA+ area of H358 + CAFs orthotopic xenografts treated with ABT-199 (100mg/kg) group (Mean ± SEM: 1.76 ± 0.28, n=12) compared with vehicle group (Mean ± SEM: 4.93 ± 0.35, n=11). DAPI (blue) was used to stain nuclei. Scale bars: 100 μm. (f) Representative photographs of harvested whole lungs and mediastinum. Scale bars: 2mm. Representative whole tissue scan images of H&E staining and IHC stained with CK7 (brown) antibody. Arrows (in blue) indicates LNM. (g) Representative photographs of harvested whole lungs and mediastinum. Representative images of H&E staining. Arrows (in blue) indicates LNM. (h) Quantification of mediastinal lymph node metastases in H358 + CAFs orthotopic xenografts treated with ABT-199 (100mg/kg) group (Mean ± SEM: 2.83 ± 0.21, n=12) compared with the vehicle group (Mean ± SEM: 6.82 ± 0.55, n=11). Quantification of mediastinal lymph node metastases in H358-only orthotopic xenografts treated with ABT-199 (100mg/kg) group (Mean ± SEM: 2.45 ± 0.28, n=11) compared with the vehicle group (Mean ± SEM: 4.20 ± 0.61, n=10). (i) Quantification of body weight of H358-only mice treated with ABT-199 (100mg/kg) (Mean ± SEM: 17.35 ± 0.60 n=11) for 8 weeks compared with vehicle (Mean ± SEM: 18.59 ± 0.32 n=10). (j) Representative PRS (red) and H&E-stained images of liver collected from mice treated with ABT-199 (100mg/kg) for 8 weeks compared with vehicle. Scale bars: 100 μm. P values were assessed by unpaired, two-tailed Student’s t-test and two-way ANOVA. (n.s., not significant, *p <0.05, **p <0.01, ***p <0.001, ****p <0.0001).
Figure 7
Figure 7
(a) Graphic illustration of the activation of lung CAFs in vitro and the lymphangiogenic role of lung CAFs in NSCLC in vivo. (Figure created in BioRender.com). (b) Graphic illustration of the pro-apoptotic effect of ABT-199 on activated lung CAFs in vitro and the effectiveness of ABT-199 on NSCLC lymphangiogenesis and mediastinal lymph node metastasis in vivo. (Figure created in BioRender.com).

Similar articles

References

    1. Osarogiagbon RU, Yu X. Mediastinal lymph node examination and survival in resected early-stage non-small-cell lung cancer in the surveillance, epidemiology, and end results database. J Thorac Oncol. (2012) 7:1798–806. doi: 10.1097/JTO.0b013e31827457db - DOI - PubMed
    1. Katsumata S, Aokage K, Ishii G, Nakasone S, Sakai T, Okada S, et al. Prognostic impact of the number of metastatic lymph nodes on the eighth edition of the TNM classification of NSCLC. J Thorac Oncol. (2019) 14:1408–18. doi: 10.1016/j.jtho.2019.04.016 - DOI - PubMed
    1. Paget S. The distribution of secondary growths in cancer of the breast. Cancer Metast Rev. (1989) 8:98–101. - PubMed
    1. Dotto GP. Multifocal epithelial tumors and field cancerization: stroma as a primary determinant. J Clin Invest. (2014) 124:1446–53. doi: 10.1172/JCI72589 - DOI - PMC - PubMed
    1. Chhabra Y, Weeraratna AT. Fibroblasts in cancer: Unity in heterogeneity. Cell. (2023) 186:1580–609. doi: 10.1016/j.cell.2023.03.016 - DOI - PMC - PubMed

LinkOut - more resources