. 2025 May 20;5(6):2542-2555.
doi: 10.1021/jacsau.5c00151. eCollection 2025 Jun 23.

In Vivo Visualization of Tumor Metabolic Activity with a Tetra Glucose-Conjugated Zinc-Phthalocyanine Photoacoustic Contrast

Affiliations

In Vivo Visualization of Tumor Metabolic Activity with a Tetra Glucose-Conjugated Zinc-Phthalocyanine Photoacoustic Contrast

Pooja A Patkulkar et al. JACS Au. .

Abstract

Tissue metabolic alterations are associated with tumor progression and serve as clinical biomarkers. Molecular imaging methods can provide a noninvasive assessment of this altered metabolic activity. Currently, in the clinic, nuclear medicine using 18F-FDG, a radioactive analogue of glucose, is the gold standard for visualizing metabolically active tumors. However, the accompanying ionizing radiation and accumulated radiation dosage limit its unchartered use. Noninvasive imaging of tissue metabolic activity without incorporating any radioactive isotope or another additional anatomical imaging is a promising alternative to nuclear medicine. Here, we introduce the first-of-its-kind tetra glucose-conjugated molecular photoacoustic (PA) contrast agent, a water-soluble and biocompatible small molecule based on the Zn-phthalocyanine scaffold. Although the Zn-phthalocyanine core is hydrophobic, the conjugation of four glucose units through their anomeric carbon ensured the water solubility of this agent, thereby aiding in its potential translation for in vivo studies. In addition, such a conjugation contributed to the high cellular uptake of this molecule in two aerobic cancer cell lines, as demonstrated using flow cytometry and epifluorescence microscopy studies. Importantly, with live metabolic assays, we elucidated the mechanism through which the contrast agent could be utilized as a glucose antagonist in nutrient-starved cells. Finally, with real-time in vivo PA tomography studies in a 4T1 mouse tumor model, we showed maximum agent accumulation within 4 h and tumor washout within 12 h post intravenous administration. Noninvasive molecular PA imaging of metabolic tumors with this probe offers a promising alternative to nuclear medicine, especially in assessing therapy response with the requirement of shorter intervals for follow-up in the clinic.

Keywords: in vivo metabolic imaging; photoacoustic imaging; phthalocyanines; small-molecule contrast; tumor metabolism.


Figures

1
1
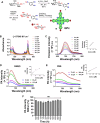
Synthesis and photophysical characterization of the PA contrast agent, GPc. (A) The three step synthesis of the tetra glucose conjugated Zn-phthalocyanine small molecule. (B) Absorbance spectra of GPc in DMSO at various concentrations, generating a molar extinction coefficient (ε) = 37,049 M–1 cm–1. (C) Fluorescence emission spectra of GPc in DMSO at different concentrations and at λem at 690 nm and λex at 400 nm. (D,E) Mean PA intensity of GPc in DMSO and in PBS at different concentrations, demonstrating the linear relationship between concentration and PA signal intensity, and solvent effect on PA sensitivity of GPc. (E) % PA intensity of GPc, acquired over 12 h, in a mouse serum sample (n = 3).
2
2
Cytotoxicity analysis of GPc in OVCAR 3 (A) and 4T1 (B) cells using the SRB colorimetric assay, performed in 3 biological repeats. Flow cytometry analysis of OVCAR 3 (C) and 4T1 (D) cells incubated for different times with 100 μM GPc (n = 3).
3
3
Epifluorescence microscopy images of 4T1 (A) and OVCAR 3 (B) cells with different incubation times of GPc (red), costained with glucose transporter membrane protein, GLUT1 (green) show cellular uptake of GPc within both cells by 2 h and retention until 6 h; scale bars: 20 μm.
4
4
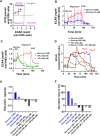
(A) Metabolic phenotypic profiling of 4T1 and OVCAR 3 cells through Seahorse glycolytic stress assay, where ECAR and OCR were measured following the sequential addition of saturating concentrations of glucose (10 mM), oligomycin, and 2-DG demonstrating both cell lines to be aerobic. (B) Changes in ECAR in OVCAR 3 cells when the stress assay is performed with a less saturated (more dilute) 1 mM concentration of glucose (blue) compared to the assay standard of 10 mM glucose (red). (C) ECAR rates in OVCAR 3 cells, when GPc is added at 500 and 250 μM instead of glucose as the nutrient substrate to glucose starved cells. (D) ECAR rates in OVCAR 3 cells when both glucose (port A) and GPc (port B) were added in a sequential manner followed by oligomycin and 2 DG. (E) Glycolytic capacitythe maximum ECAR following inhibition of mitochondrial ATP production subtracted from the nonglycolytic acidification rate and (F) glycolytic reserve for OVCAR 3 for the competition assay.
5
5
Experimental design and timeline for the in vivo and ex vivo imaging with (A) details of 4T1 tumor implantation in athymic nude mice in different mice for serial imaging (Cohort 1) and cross-sectional imaging (Cohort 2 and 3) and ex vivo imaging of tissues post excision and in vivo studies. (B) In vivo PA images of a 2D slice displaying the anatomy in xy plane with the tumor visible (circled in yellow), uptake of GPc (jet) overlaid on the anatomy (gray) in two mice at 30 min and 2 or 4 h post intravenous administration of GPc, and an overlay of the intrinsic contrast of deoxyhemoglobin (Hb, blue), and oxyhemoglobin (HbO2, red) and total hemoglobin (HbT) in the same mice.
6
6
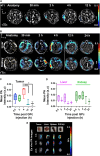
(A) The pharmacokinetics of uptake and washout of GPc in and from the tumor through in vivo real-time PA imaging longitudinally at different time points from 30 min to 12 h postadministration of GPc (jet) and (B) the biodistribution profiles in the upper and lower abdominal region, especially in the liver and kidney (marked on anatomical slice, yellow dash) across time, the images to the left of the white dashed line indicate images from the same mouse, whereas the 12 and 24 h in vivo biodistribution profile are from mice that were cross-sectionally imaged (Cohort 2 and Cohort 3). (C) The quantification of GPc uptake and washout in and out of the tumor from the mean PA intensity of the tumor volume of interest (VOI). (D) Quantification of GPc uptake and retention in the clearance organs of liver and kidney from the in vivo images across time. (E) PA contrast images of GPc (jet) overlaid on the grayscale anatomical image of the excised tissues at 6 h, 12 h, and 24 h post GPc administration.
7
7
Histopathology results show the H&E staining of the liver (A), kidney (B), and spleen (C) from the mice. The control group (saline), nontumorigenic mice with GPc single (+) and double dosing (++), and GPc injected 4T1 tumor-bearing with the dosage used in biodistribution studies. CV: central vein, PV: portal vein, S: sinusoids, H: hepatocytes, G: glomerulus, BC: Bowman’s capsule, T: tubule, RP: red pulp, F: follicle. N = 2 per group, magnification (20×), scale bar 25 μm. (D) Serum biochemistry profiles in 2 control mice and 2 nontumorigenic mice that received two doses of GPc. ALP = alkaline phosphatase, AST = aspartate aminotransferase, and ALT: alanine aminotransferase.

Similar articles

References

    1. Warburg O.. On the Origin of Cancer Cells. Science. 1956;123(3191):309–314. doi: 10.1126/science.123.3191.309. - DOI - PubMed
    1. Yoo H. C., Yu Y. C., Sung Y., Han J. M.. Glutamine Reliance in Cell Metabolism. Exp. Mol. Med. 2020;52(9):1496–1516. doi: 10.1038/s12276-020-00504-8. - DOI - PMC - PubMed
    1. Faubert B., Solmonson A., DeBerardinis R. J.. Metabolic Reprogramming and Cancer Progression. Science. 2020;368(6487):152. doi: 10.1126/science.aaw5473. - DOI - PMC - PubMed
    1. Ntziachristos V., Pleitez M. A., Aime S., Brindle K. M.. Emerging Technologies to Image Tissue Metabolism. Cell Metab. 2019;29(3):518–538. doi: 10.1016/j.cmet.2018.09.004. - DOI - PubMed
    1. Faubert B., DeBerardinis R. J.. Analyzing Tumor Metabolism In Vivo. Annu. Rev. Cancer Biol. 2017;1:99–117. doi: 10.1146/annurev-cancerbio-050216-121954. - DOI

LinkOut - more resources