. 2025 May 20;5(6):2699-2712.
doi: 10.1021/jacsau.5c00305. eCollection 2025 Jun 23.

Molecularly Defined Glycocalyx Models Reveal AB5 Toxins Recognize Their Target Glycans Superselectively

Affiliations

Molecularly Defined Glycocalyx Models Reveal AB5 Toxins Recognize Their Target Glycans Superselectively

Laia Saltor Núñez et al. JACS Au. .

Abstract

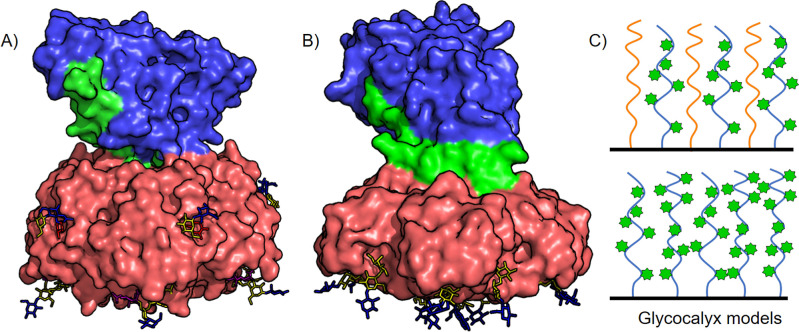
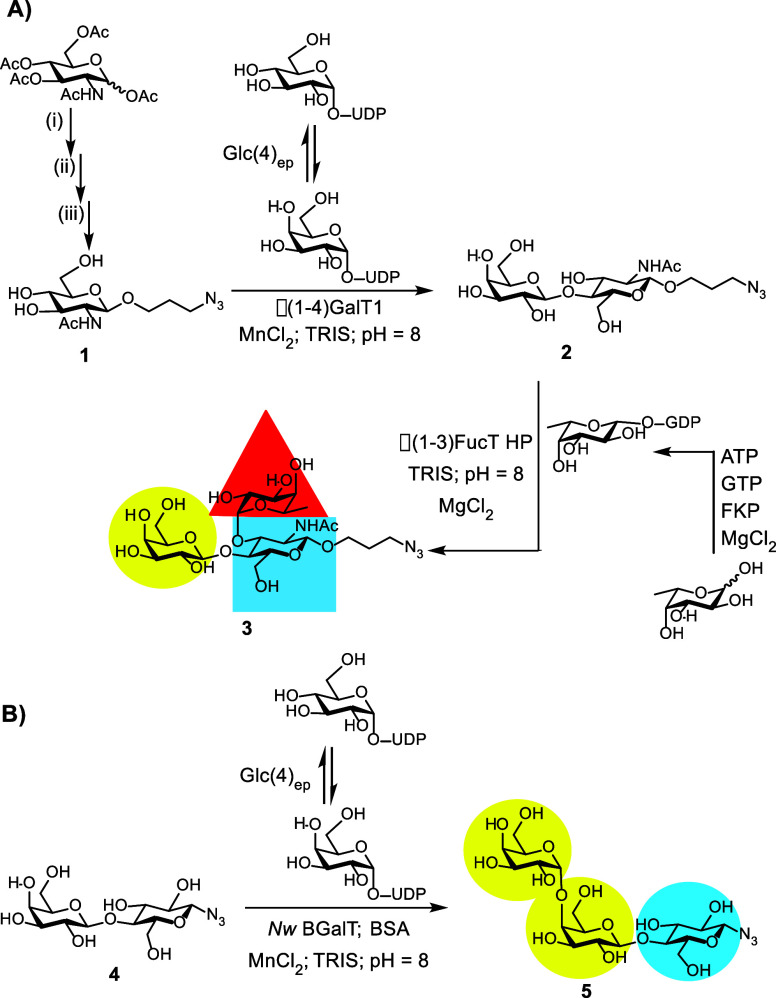
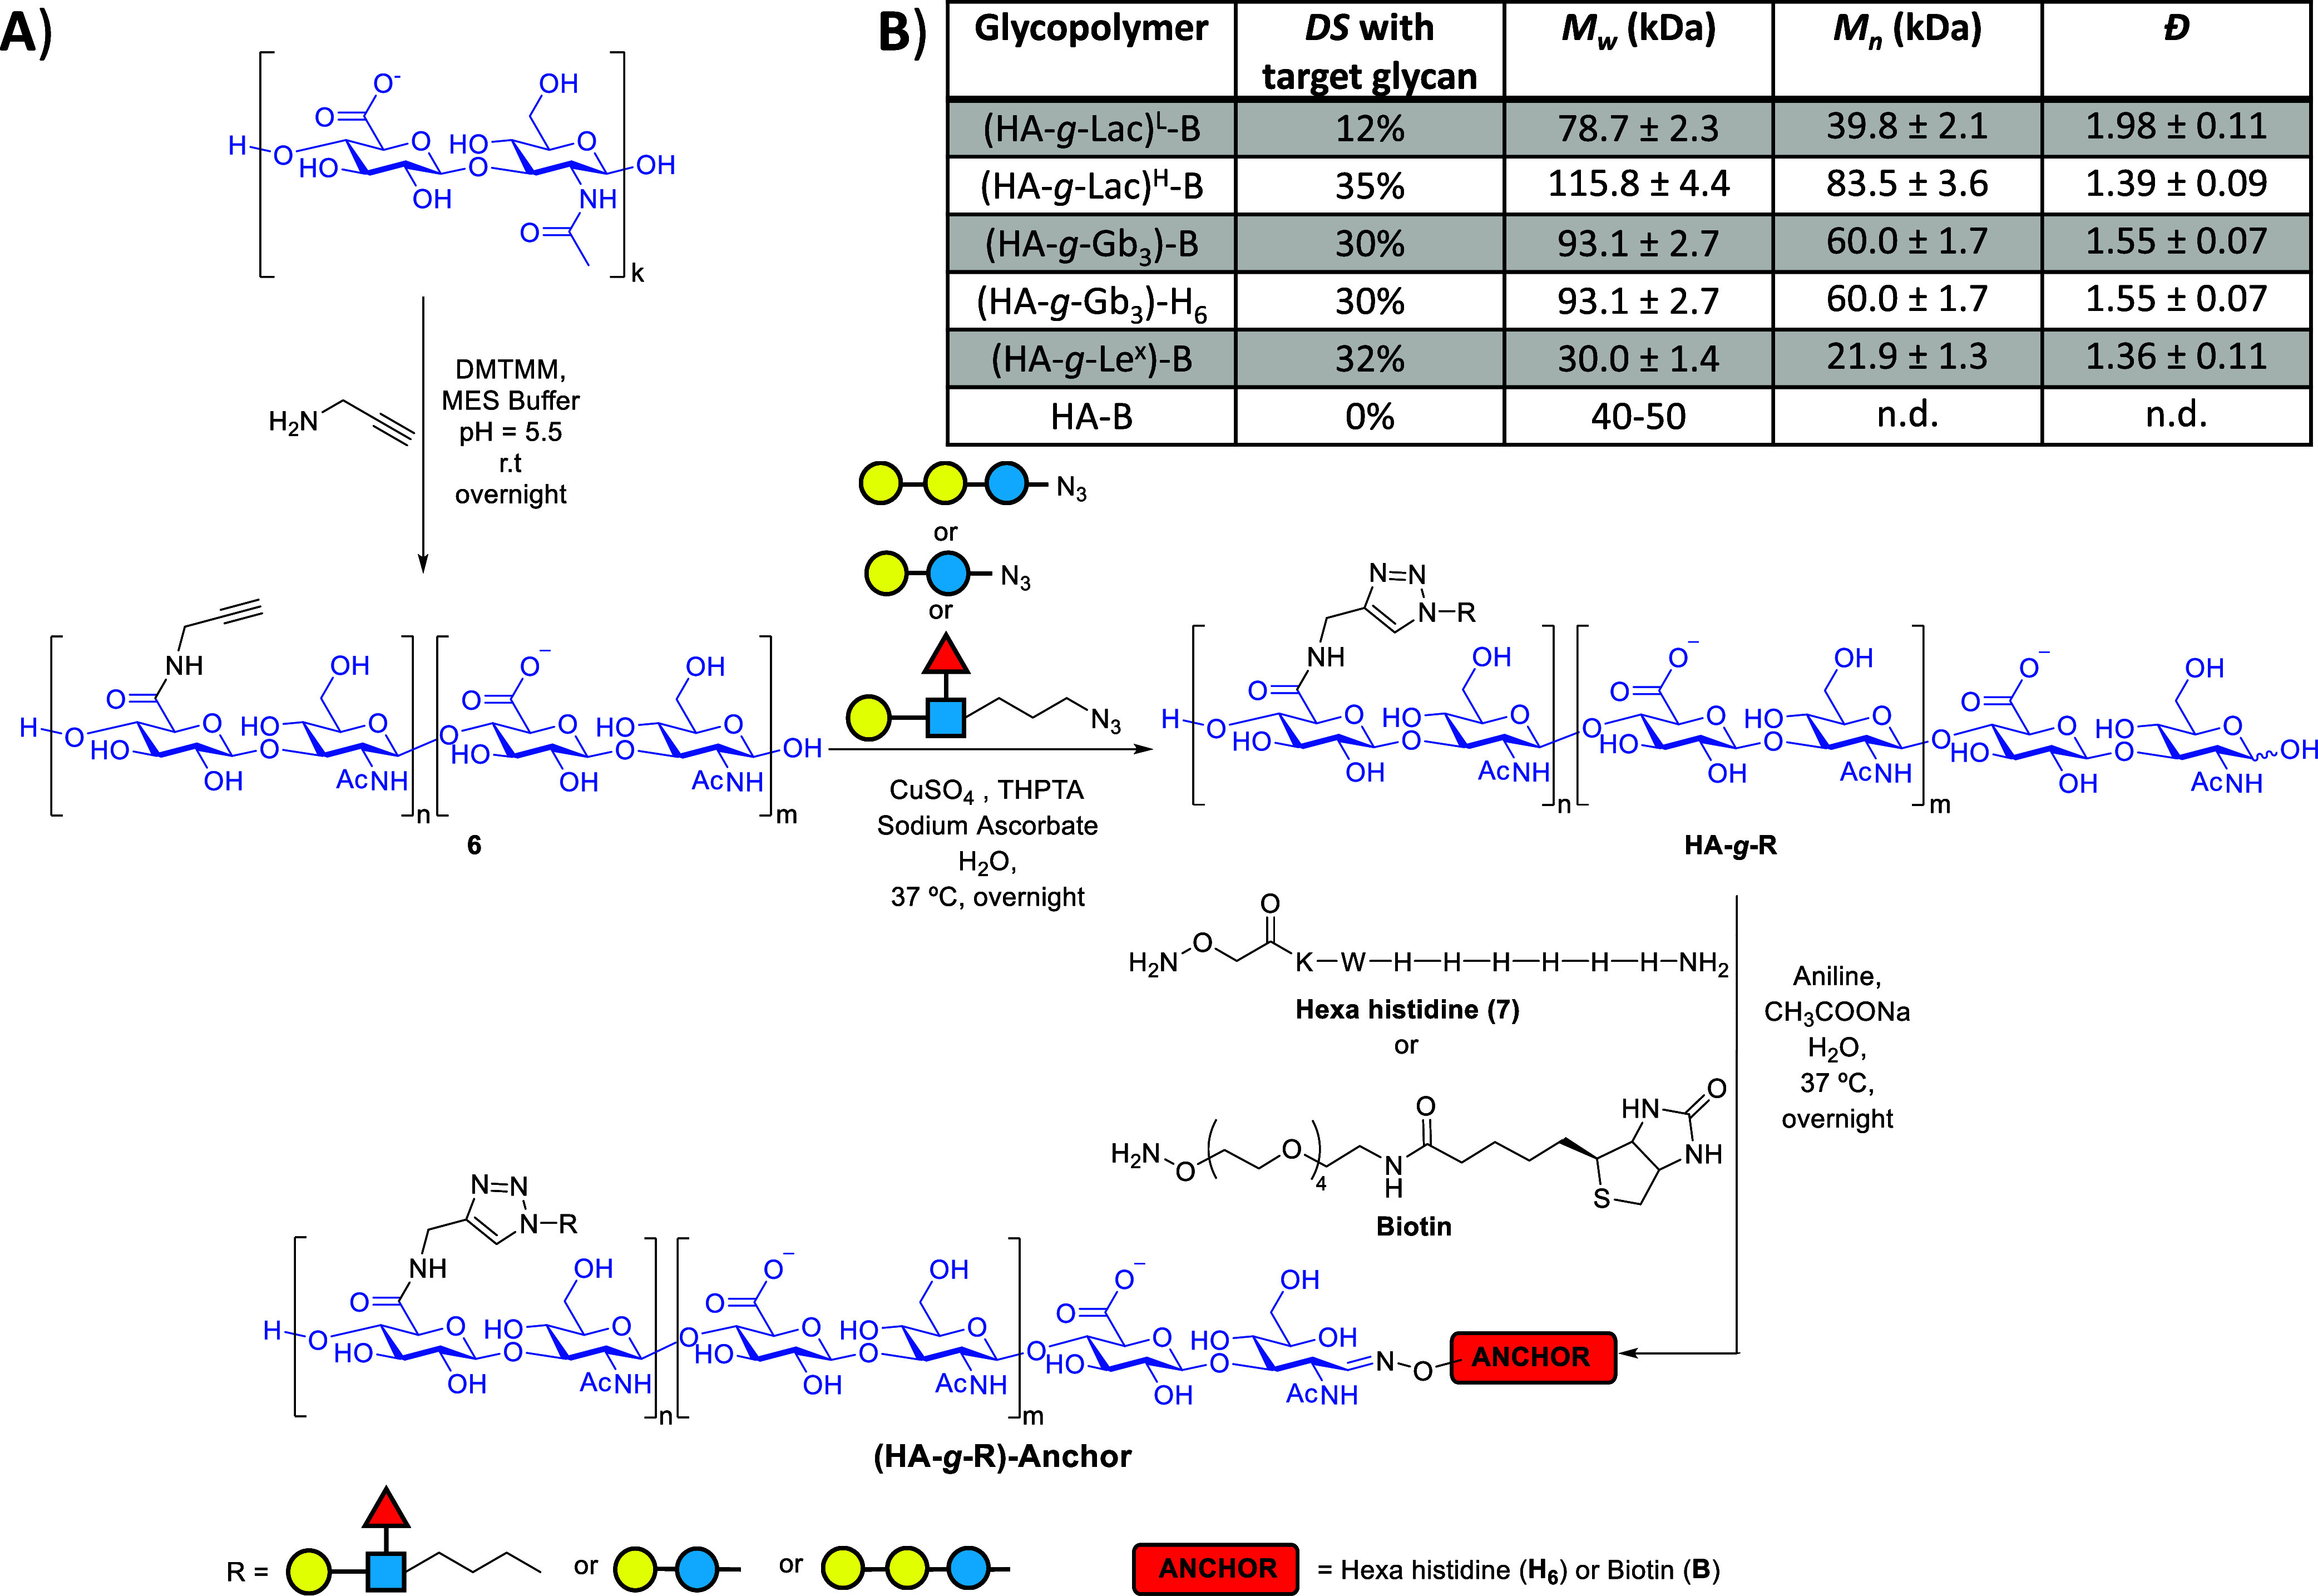
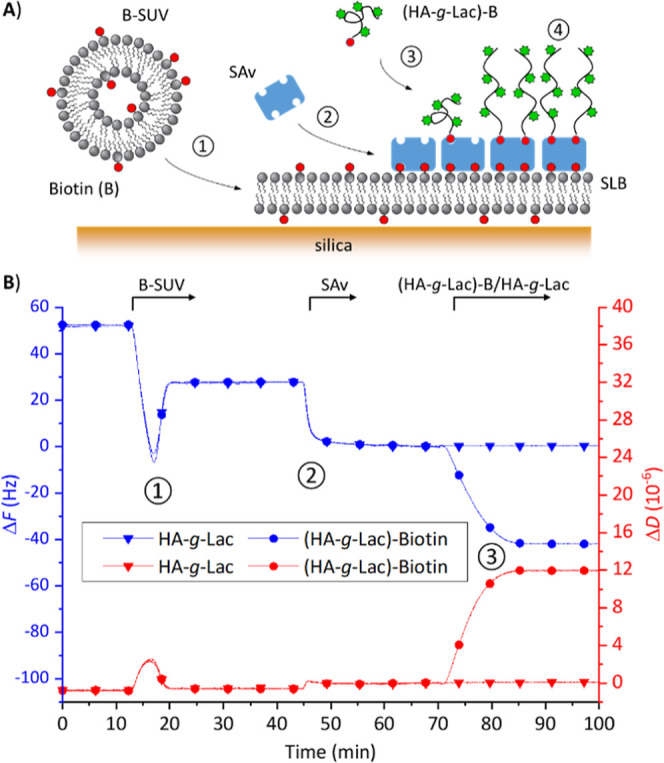
AB5 toxins are a class of bacterial toxins that recognize cell surface carbohydrates to facilitate their uptake by the target cell. Among them are cholera toxin (CT) from Vibrio cholerae that causes cholera, and Shiga toxin (STx) from Shigella dysenteriae and certain strains of Escherichia coli, which cause hemolytic uremic syndrome. While the glycolipid ligands for CT and STx (gangliosides GM1 and Gb3, respectively) have long been known, recent studies have shown that fucosylated structures, like Lewis x (Le x ), also play a role in CT binding. This realization raises questions about the importance of interactions between these toxins and nonglycolipid components of the glycocalyx, which are not well understood. To address this challenge, we created glycocalyx models of defined thickness and tunable molecular composition through grafting of mucin-like glycopolymers on solid-supported lipid bilayers (SLBs). The synthesized mucin-like glycopolymers comprised a hyaluronic acid (HA) backbone, an anchor tag (biotin or hexa-histidine) at the HA reducing end, and side chains of relevant oligosaccharides (Le x , Gb3, or lactose) at defined densities. Analyses by quartz crystal microbalance with dissipation monitoring and spectroscopic ellipsometry provided quantification of the thickness, mesh size, and target glycan concentration of the glycocalyx models and of toxin binding kinetics. The B subunit pentamers of both CT and STx showed significantly enhanced affinity in the model glycocalyx environment due to multivalent binding to their respective target glycans. Most notably, toxin binding increased superlinearly with the concentration of the target glycan in the model glycocalyx. We propose that such "superselective" binding is an important factor in host cell selection. Our approach provides a new set of tools to make designer glycocalyces and analyze multivalent protein-glycan interactions in a controlled environment.

Keywords: QCM-D; biomimetic interfaces; glycoconjugate; lectin binding; superselectivity; synthetic glycocalyx.


Figures

1
1
Models of (A) cholera toxin and (B) Shiga toxin bound to their carbohydrate ligands. The model of cholera toxin bound to GM1 (bottom face) and Lewis x (lateral face) is based on Protein Data Bank files 3CHB, 1XTC, and 6HJD. The model of Shiga toxin bound to Gb3 oligosaccharide (bottom face) is based on Protein Data Bank files 1BOS and 1DM0. In each case, the B5 subunit is colored red, the A1 toxin domain is colored blue, and the A2 linker peptide is colored green. The oligosaccharides are shown as stick representations in the colors corresponding to the symbolic nomenclature for glycans: glucose and N-acetylglucosamine in blue; galactose and N-acetylgalactosamine in yellow; fucose in red; and sialic acid in purple. (C) Schematic representation of a glycocalyx model with tunable target glycan density to analyze multivalent binding of B5 subunits in molecularly defined microenvironments. The glycan (represented as a green star) density is modified by mixing different mucin-like structures (top) up to saturating the surface with one type of glycopolymer (bottom).
2
2
(A) Chemoenzymatic synthesis of azidopropyl Le x -N3: (i) trimethylsilyl trifluoromethanesulfonate (TMSOTf), CH2Cl2, r.t, 2.5 h, 90%; (ii) 3-azidopropan-1-ol, camphorsulfonic acid, DCE, 80 °C, overnight, 30%; and (iii) sodium methoxide, MeOH, r.t., 3 h, 68%. (B) Enzymatic synthesis of Gb3-N3.
3
3
A) Synthesis of (HA- g -R)-Anchor glycopolymers as mucin-like structures. R = Le x , Gb3, or Lac, and anchor = biotin (B) or hexa-histidine (H6), as schematically shown. (B) Table of the mucin-like structures synthesized, with their physical properties. Degree of substitution (DS) with R per HA disaccharide was determined by 1H NMR; weight-average molecular mass (M w), number-average molecular mass (M n ), and dispersity ( = M w/M n) were determined by SEC-MALS; see Methods for details.
4
4
(A) Scheme for the supramolecular self-organization process to form glycocalyx models: (1) adsorption of small unilamellar vesicles containing biotinylated lipids (B-SUVs) on the silica surface, and their subsequent rupture to form a supported lipid bilayer (SLB); (2) binding of streptavidin (SAv) by at least two biotins on the SLB to form a SAv monolayer; (3) anchorage of the biotinylated mucin-like glycopolymer and formation of a glycopolymer brush. (B) Quartz crystal microbalance with dissipation monitoring (QCM-D) data showing frequency shift (ΔF), dissipation shift (ΔD; overtone i = 5) demonstrating stable and specific anchorage of (HA- g -Lac L )-B via its biotin on a SAv-on-SLB surface. Conditions: B-SUVs (DOPC/DOPE-CAP-B 95:5 (mol/mol), 50 μg/mL), SAv (20 μg/mL), (HA- g -Lac L )-B/HA- g -Lac L (20 μg/mL); all solutions were prepared in working buffer (HBS; HEPES 10 mM, NaCl 150 mM, pH 7.4). Arrows atop the graph indicate the start and duration of incubation with each sample as indicated; during remaining times, plain working buffer was flowed over the sensor surface.
5
5
QCM-D data showing frequency shift (ΔF), dissipation shift (ΔD; overtone i = 5) demonstrating specific and largely reversible binding of STxB to a Gb3 presenting model glycocalyx. Conditions: SAv-on-SLB surfaces (not shown); (HA- g -Gb 3 )-B – 20 μg/mL (lines with square symbols) or none (lines with triangle symbols); STxB (0.4 and 2 μM, as indicated); all in HBS working buffer. Arrows atop the graph indicate the start and duration of incubation with each sample (solid vs dashed arrow for 2 μM STxB with vs without glycopolymer); plain working buffer was flowed over the sensor surface during remaining times.
6
6
Quantifying B5 subunit binding avidities in model glycocalyces. (A) Representative titration curve obtained by SE for STxB in a (HA- g -Gb 3 )-B model glycocalyx. (B) Equilibrium B subunit surface densities Γeq,B5 subunit as a function of the B5 subunit concentration for STxB and HA- g -Gb 3 (blue circles), and for CTB and HA- g -Le x (red triangles). Lines in corresponding colors are best fits with the Langmuir isotherm, Γeq,B5subunit = Γmax,B5subunit·[B5 subunit]/(K d+[B5 subunit]), with results indicated in the table (inset). Data taken from (A) for STxB/Gb3 interactions and from Figure S14 for CTB/Le x interactions. Conditions: SAv-on-SLB with maximal (HA-g-Gb3)-B and (HA-g-Le x )-B coverages, corresponding to c Gb3 = 0.024 M and cLe x = 0.021 M (Table ), in HBS working buffer.
7
7
AB5 toxins recognize their target glycans superselectively. (A) Schemes of model glycocalyx assemblies deployed to probe for glycan density-dependent binding. Mucin-like structures with the target glycan (Gb3 for STxB and Le x for CTB) were mixed with structures of similar size representing noninteracting (Lac for STxB) or no (for CTB) glycans other than the HA backbone. (B) Plots of -ΔF eq,STxB, a measure of STxB binding, against the concentration of Gb3 in the model glycocalyx film. Most data are extracted from Figure S15B for 0.4 μM and 2 μM STxB (color coded as indicated), apart from the data points at the highest Gb3 concentration, which were derived from the (HA- g -Gb 3 )-H 6 data in Figure S10. (C) Plot of -ΔF limit,CTB, a measure of CTB binding, against the concentration of Le x in the model glycocalyx film. Data are extracted from Figure S16B for 0.7 μM and 3.5 μM CTB (color coded as indicated). Dashed lines in matching colors in B and C are power law fits with exponents α (i.e., straight lines in the log–log plots with slope α) as indicated.

Similar articles

References

    1. Reitsma S., Slaaf D. W., Vink H., Van Zandvoort M. A. M. J., Oude Egbrink M. G. A.. The Endothelial Glycocalyx: Composition, Functions, and Visualization. Pflugers Arch. Eur. J. Physiol. 2007;454(3):345–359. doi: 10.1007/s00424-007-0212-8. - DOI - PMC - PubMed
    1. Tarbell J. M., Pahakis M. Y.. Mechanotransduction and the Glycocalyx. J. Int. Med. 2006;259(4):339–350. doi: 10.1111/j.1365-2796.2006.01620.x. - DOI - PubMed
    1. Varki A.. Biological Roles of Oligosaccharides: All of the Theories Are Correct. Glycobiology. 1993;3(2):97–130. doi: 10.1093/glycob/3.2.97. - DOI - PMC - PubMed
    1. Varki A.. Biological Roles of Glycans. Glycobiology. 2017;27(1):3–49. doi: 10.1093/glycob/cww086. - DOI - PMC - PubMed
    1. Honigfort D., Zhang M., Verespy S., Godula K.. Engineering of Spectator Glycocalyx Structures to Evaluate Molecular Interactions at Crowded Cellular Boundaries. Faraday Discuss. 2019;219:138–153. doi: 10.1039/C9FD00024K. - DOI - PMC - PubMed

LinkOut - more resources