. 2025 Jun 26;4(6):e70058.
doi: 10.1002/jex2.70058. eCollection 2025 Jun.

Systematic Evaluation of Isolation Techniques and Freeze-Thaw Effects on Plasma Extracellular Vesicle Heterogeneity and Subpopulation Profiling

Affiliations

Systematic Evaluation of Isolation Techniques and Freeze-Thaw Effects on Plasma Extracellular Vesicle Heterogeneity and Subpopulation Profiling

Xueqi Li et al. J Extracell Biol. .

Abstract

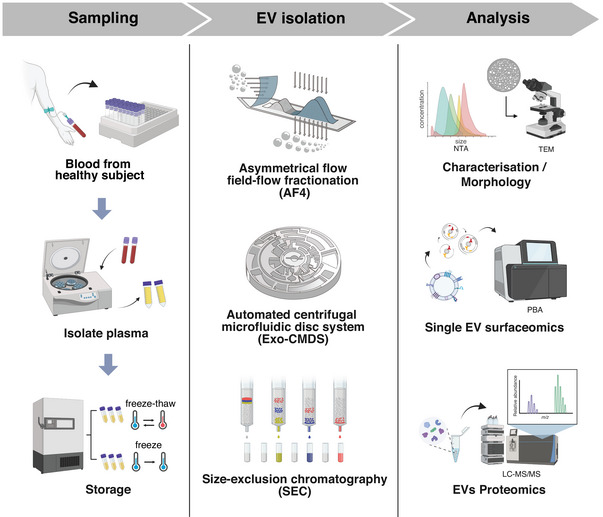
Extracellular vesicles (EVs) are increasingly recognized as promising disease biomarkers and therapeutic carriers. However, standardizing blood-derived EV isolation remains challenging due to the heterogeneity of EV populations and variability among isolation techniques. In this study, we systematically evaluated three distinct EV isolation methods, including asymmetrical flow field-flow fractionation (AF4), size-exclusion chromatography (SEC) and automated centrifugal microfluidic disc system combined with functionalized membranes (Exo-CMDS), to compare their efficiency in isolating EVs from both freshly frozen and freeze-thawed plasma samples. We utilized an integrative approach combining Proximity-dependent Barcoding Assay (PBA) for single-EV surface protein profiling, Liquid Chromatography-Mass Spectrometry (LC-MS/MS) for bulk proteomic analysis, along with transmission electron microscopy (TEM) and nanoparticle tracking analysis (NTA) to assess EV yield, morphology, surface protein expression and subpopulation diversity. Our results revealed significant differences in three EV isolation methods. AF4 is particularly enriched for EV subpopulations expressing high levels of classical tetraspanins (e.g., CD81, CD9 and CD151), and single-pass membrane proteins (e.g., ITGA4 and ITAGB1). Exo-CMDS demonstrated the highest reproducibility across samples, isolating specific EV subpopulations enriched in markers like CD5. SEC provided the highest yield but co-isolated significant amounts of non-vesicular particles, including lipoproteins. The findings contribute valuable insights toward standardized and reliable EV isolation practices for research and clinical applications.

Keywords: EV isolation; extracellular vesicles; plasma; proteomics; single EV; small EVs; subpopulations; surfaceomics.


Conflict of interest statement

The authors declare no conflicts of interest.

Figures

FIGURE 1
FIGURE 1
Overview of the study design. Three distinct EV isolation technologies, AF4, Exo‐CMDS and SEC were used to compare their efficiency in isolating EVs from both freshly frozen and freeze‐thawed plasma samples. For each isolation technology, NTA was used to determine the particle size distribution and concentration, TEM to examine the morphology of the isolated particles, PBA for single‐EV surface proteome profiling and LC‐MS/MS to assess the bulk proteome. Figure was created by BioRender.
FIGURE 2
FIGURE 2
Isolation and identification of plasma‐derived particles. (a) TEM images showing the typical cup‐shaped or spherical EV morphology of EVs isolated by AF4, SEC and Exo‐CMDS, respectively. (b) Count (per mL) and (c) size (nm) of particles isolated by the three technologies using NTA.
FIGURE 3
FIGURE 3
EV characterization based on the PBA‐based EV surface proteome profiling. (a) PCA plot revealing the differences of the PBA‐based bulk‐level surface protein expression patterns of EVs isolated by different technologies. (b) Heatmap showing the similarity of the PBA‐based bulk‐level surface protein expression of EVs isolated by different technologies, evaluated by the Spearman Correlation Analysis. (c) Violin plots showing the distribution of Spearman correlation coefficients between each two EV samples from each technology group. The coefficients of variation (CV) values were calculated and annotated in each group. (d) Bar plots showing the number of EVs expressing one, two, three or more surface proteins in each technology group. (e) Bar plots showing the proportion of EV numbers expressing these marker proteins. The whiskers represent mean ± SD. The EV proportions were analysed by ANOVA, followed by Tukey's HSD post‐hoc test. The statistical results were shown in Table S9. Figure 3(a–c, e) panel share the same colour legend.
FIGURE 4
FIGURE 4
Identification of EV subpopulations. (a) Scatter plot showing the significantly upregulated proteins in EVs expressing only one protein in each technology group. ANOVA was used to detect the significantly upregulated proteins with FDR < 0.05. Pink dots indicate technology‐exclusive proteins and red dots indicate proteins reported by MISEV. (b) UMAP plot showing the identified 15 EV subpopulations (PBA_c0–c14) based on the PBA‐based single‐EV proteome profiling of all samples. (c) UMAP plot showing the identified EV subpopulations in each technology group. EVs expressing more than 2 proteins were included in the UMAP plots. (d) Bar plots revealing the fractions of technology‐specific EV subpopulations in each technology group at individual level. (e) Bubble plot showing the average expression levels of marker proteins in each EV subpopulation. The size of the bubble indicates the percentage of EVs expressing the corresponding markers. The length of the bar indicates the number of EVs in each subpopulation. (f) The left UMAP plots showing the expression levels of marker proteins CD5 and CD151 at single‐EV level. The blue colour scales represent the annotated protein expression levels. The right bar plots showing the average expression levels of CD5 and CD151 in each EV subpopulation. (g) Heatmap showing the similarity of surface protein expression patterns of technology‐specific EV subpopulations. Figure 4(b–d, f) panel share the same colour legend.
FIGURE 5
FIGURE 5
Characterization of LC‐MS/MS‐based proteome profiling of EVs. (a) Venn diagram showing the overlaps of proteins detected by different technologies. (b) The distribution of protein expression levels of EVs in different technology groups. (c) Violin plots showing the protein expression levels of EVs from the freeze‐thaw and non‐freeze‐thaw plasma samples in different technology groups. Bar plots showing the expression levels of (d) the classical EV markers, (e) lipoproteins and (f) exomere or supermere proteins in different technology groups. The whiskers represent mean ± SD. The protein expression levels were compared by ANOVA. The statistical result was shown in Table S13. (g) PCA plots revealing the differences of LC‐MS/MS‐based protein expression patterns of EVs isolated by the three technologies. (h) Heatmap showing the similarity of the MS/MS‐based protein expression of EVs isolated by different technologies, evaluated by the Spearman Correlation Analysis. (i) Violin plots showing the distribution of Spearman correlation coefficients between each two EV samples from each technology group. The CV values were calculated and annotated in each group. (j) Ternary plot illustrating the expression patterns of technology‐specific proteins in the three technology groups. Figure 5(b, d–i) panel share the same colour legend.
FIGURE 6
FIGURE 6
Clustering and functional analysis of LC‐MS/MS‐based proteome profiling of EVs. (a) Heatmap showing the 17 distinct protein clusters (MS_c1–c17) based on the Hierarchical clustering analysis of the expression levels of 1588 proteins quantified by LC‐MS/MS. (b) Heatmap showing the overlaps between the above 17 protein clusters and technology‐detected only or ‐elevated proteins. The significance was evaluated by the Hypergeometric Test and * represents p < 0.05. (c) The correlations between the expression levels measured by PBA and LC‐MS/MS for the classical EV markers CD9 and CD81, evaluated by Pearson Correlation. (d) Sankey diagram showing the technology specificity of the proteins from each of the 17 clusters. Cellular component terms were annotated for these proteins by the GO enrichment analysis. (e) Chord diagrams showing the (e) tissue and (f) single‐cell specificity of the proteins from each cluster.

Similar articles

References

    1. Anand, S. , Samuel M., and Mathivanan S.. 2021. “Exomeres: A New Member of Extracellular Vesicles Family.” In New Frontiers: Extracellular Vesicles, edited by Mathivanan S. Fonseka P. Nedeva C., and Atukorala I., 89–97. Springer International Publishing. 10.1007/978-3-030-67171-6_5. - DOI - PubMed
    1. Arraud, N. , Linares R., Tan S., et al. 2014. “Extracellular Vesicles From Blood Plasma: Determination of Their Morphology, Size, Phenotype and Concentration.” Journal of Thrombosis and Haemostasis 12, no. 5: 614–627. 10.1111/jth.12554. - DOI - PubMed
    1. Benayas, B. , Morales J., Egea C., Armisén P., and Yáñez‐Mó M.. 2023. “Optimization of Extracellular Vesicle Isolation and Their Separation From Lipoproteins by Size Exclusion Chromatography.” Journal of Extracellular Biology 2, no. 7: e100. 10.1002/jex2.100. - DOI - PMC - PubMed
    1. Burton, J. B. , Carruthers N. J., and Stemmer P. M.. 2023. “Enriching Extracellular Vesicles for Mass Spectrometry.” Mass Spectrometry Reviews 42, no. 2: 779–795. 10.1002/mas.21738. - DOI - PubMed
    1. Cai, Y. , Chen T., Cai Y., et al. 2024. “Surface Protein Profiling and Subtyping of Extracellular Vesicles in Body Fluids Reveals Non‐CSF Biomarkers of Alzheimer's Disease.” Journal of Extracellular Vesicles 13, no. 4: 1‐20. 10.1002/jev2.12432. - DOI - PMC - PubMed

LinkOut - more resources