. 2025 Jun 12:15:1603369.
doi: 10.3389/fcimb.2025.1603369. eCollection 2025.

Epidemiological trends of influenza A and B in one hospital in Chengdu and national surveillance data (2019-2024)

Affiliations

Epidemiological trends of influenza A and B in one hospital in Chengdu and national surveillance data (2019-2024)

Xiang Li et al. Front Cell Infect Microbiol. .

Abstract

Background: Influenza A (Flu A) and Influenza B (Flu B) are major contributors to seasonal epidemics, causing significant morbidity and mortality worldwide. Understanding their epidemiological trends is essential for optimizing prevention and control strategies.

Objective: This study aims to analyze the epidemiological trends of Flu A and Flu B, compare hospital-based and national surveillance data, and evaluate the impact of COVID-19 on influenza transmission to provide scientific evidence for influenza control measures.

Methods: We analyzed influenza positivity rates from Sichuan Jinxin Xinan Women and Children Hospital data (HD) and Chinese National Influenza Center (CNIC) between 2019 and 2024. Temporal trends, subtype distributions, and the effects of non-pharmaceutical interventions (NPIs) were assessed.

Results: Influenza activity exhibited significant temporal variations. In HD, the highest cumulative positivity rate of Flu A + Flu B was observed in 2023 (31.9%), whereas the lowest rate occurred during the COVID-19 pandemic (2020-2022), with a nadir in 2021 (2.0%). Flu A remained the predominant subtype in HD except in 2021, whereas CNIC data showed a relatively higher proportion of Flu B. Weekly positivity rates displayed distinct seasonal trends in CNIC data but not in HD. A comparative analysis of pre-pandemic (2019), pandemic (2020-2022), and post-pandemic (2023-2024) phases indicated that NPIs had a stronger suppressive effect on Flu A than on Flu B.

Conclusion: Hospital-based and national influenza surveillance data showed heterogeneity in subtype proportions, seasonal trends, and pandemic-related impacts. These findings underscore the importance of integrating multiple surveillance sources for a comprehensive understanding of influenza dynamics. Enhancing vaccine coverage, implementing targeted public health interventions, and optimizing resource allocation are crucial for mitigating the influenza burden in the post-pandemic era.

Keywords: COVID-19; epidemiology; influenza A; influenza B; non-pharmaceutical interventions.


Conflict of interest statement

The authors declare that the research was conducted in the absence of any commercial or financial relationships that could be construed as a potential conflict of interest.

Figures
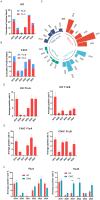
Figure 1
Figure 1
Analysis of influenza A and B positivity rates in HD and CNIC datasets. (A) Cumulative positivity rates of influenza A and B in HD. This figure illustrates the cumulative positivity rates of influenza A (Flu A) and influenza B (Flu B) cases in the HD (hospital data) over the study period. (B) Cumulative positivity rates of Flu A and Flu B in CNIC data. This figure illustrates the cumulative positivity rates of Flu A and Flu B cases in the CNIC (Chinese National Influenza Center) dataset over the study period. (C) Polar plot of Flu A and Flu B positivity rates in HD and CNIC data from 2019 to 2024. This figure presents a polar plot comparing the positivity rates of Flu A and Flu B in both HD and CNIC datasets over the period from 2019 to 2024. (D) Bar chart of average weekly positivity rates for Flu A and Flu B in HD data. This figure presents a bar chart depicting the average weekly positivity rates of Flu A and Flu B cases within the HD. (E) Bar chart of average weekly positivity rates for Flu A and Flu B in CNIC data. This figure presents a bar chart depicting the average weekly positivity rates of Flu A and Flu B cases within the CNIC dataset. (F) Comparison of average positivity rates of Flu A and Flu B between HD and CNIC datasets, shown as paired bars by year. ** indicates p<0.01; ****indicates p<0.0001.
Figure 2
Figure 2
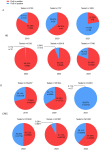
Proportions of influenza A and B cases among influenza-positive cases in HD and CNIC datasets. (A) Pie chart depicting the proportion of influenza A and B cases among influenza-positive cases in HD. (B) Pie chart depicting the proportion of influenza A and B cases among influenza-positive cases in CNIC data. HD, hospital data; CNIC, Chinese National Influenza Center.
Figure 3
Figure 3
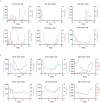
Weekly distribution of influenza A testing samples and positivity rates in HD and CNIC datasets. (A) Weekly distribution of influenza A testing samples and positivity rates in HD. (B) Weekly distribution of influenza A testing samples and positivity rates in CNIC. HD, hospital data; CNIC, Chinese National Influenza Center.
Figure 4
Figure 4
Weekly distribution of influenza B testing samples and positivity rates in HD and CNIC datasets. (A) Weekly distribution of influenza B testing samples and positivity rates in HD. (B) Weekly distribution of influenza B testing samples and positivity rates in CNIC. HD, hospital data; CNIC, Chinese National Influenza Center.
Figure 5
Figure 5
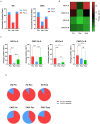
Analysis of influenza A and B positivity rates in HD and CNIC datasets during the Pre, Pan, and Post COVID-19 periods. (A) Bar charts depict the cumulative positivity rates of influenza A and B in HD and CNIC datasets during the pre-pandemic (Pre), pandemic (Pan), and post-pandemic (Post) COVID-19 periods. (B) Heatmap depicting the positivity rates of influenza A and B in HD and CNIC datasets during the Pre, Pan, and Post COVID-19 periods. (C) Bar charts depicting the weekly average positivity rates of influenza A and B in HD and CNIC datasets during the P Pre, Pan, and Post COVID-19 periods. (D) Pie charts depicting the proportions of influenza A and B cases among influenza-positive cases in HD and CNIC datasets during the Pre, Pan, and Post COVID-19 periods. HD, hospital data; CNIC, Chinese National Influenza Center. ns indicates no significant; ** indicates p<0.01; ****indicates p<0.0001.

Similar articles

References

    1. Alexander M. E., Bowman C., Moghadas S. M., Summers R., Gumel A. B., Sahai B. M.. (2004). A vaccination model for transmission dynamics of influenza. SIAM J. Appl. Dynamical Syst. 3, 503–524. doi: 10.1137/030600370 - DOI
    1. Bi Y., Yang J., Wang L., Ran L., Gao G. F. (2024). Ecology and evolution of avian influenza viruses. Curr. Biol. 34, R716–r721. doi: 10.1016/j.cub.2024.05.053 - DOI - PubMed
    1. Caini S., Kroneman M., Wiegers T., El Guerche-Séblain C., Paget J. (2018). Clinical characteristics and severity of influenza infections by virus type, subtype, and lineage: a systematic literature review. Influenza Other Respir. Viruses 12, 780–792. doi: 10.1111/irv.2018.12.issue-6 - DOI - PMC - PubMed
    1. Cao G., Guo Z., Liu J., Liu M. (2023). Change from low to out-of-season epidemics of influenza in China during the COVID-19 pandemic: A time series study. J. Med. Virol. 95, e28888. doi: 10.1002/jmv.28888 - DOI - PubMed
    1. Chan K. S., Liang F. W., Tang H. J., Toh H. S., Yu W. L. (2020). Collateral benefits on other respiratory infections during fighting COVID-19. Med. Clin. (Barc) 155, 249–253. doi: 10.1016/j.medcli.2020.05.026 - DOI - PMC - PubMed

LinkOut - more resources