. 2025 Jun 9:33:101957.
doi: 10.1016/j.mtbio.2025.101957. eCollection 2025 Aug.

Silk fibroin hydrogel with recombinant silk fibroin/NT3 protein enhances wound healing by promoting type III collagen synthesis and hair follicle regeneration in skin injury

Affiliations

Silk fibroin hydrogel with recombinant silk fibroin/NT3 protein enhances wound healing by promoting type III collagen synthesis and hair follicle regeneration in skin injury

Yingying Yan et al. Mater Today Bio. .

Abstract

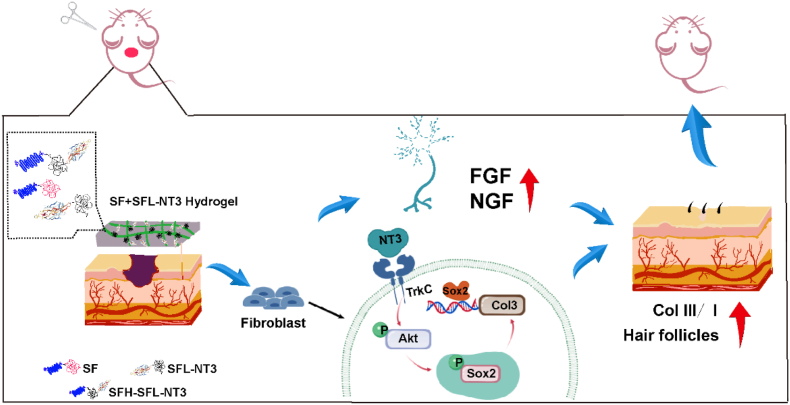
Scar formation on skin wounds remains a considerable challenge in regenerative medicine. Various wound dressings, composed of biomaterials alone or in combination with bioactive factors, have been developed to improve healing outcomes. In this study, we designed a recombinant neurotrophin-3 (NT3) containing a silk fibroin light chain (SFL) and developed a silk fibroin (SF) hydrogel with NT3 activity. The SFL-NT3 protein bound to the heavy-light chains of SF and was efficiently integrated into the SF hydrogel. We evaluated the effect of the recombinant NT3-SFL hydrogel on wound healing in a mouse skin injury model. This hydrogel enhanced wound healing. Remarkably, SFL-NT3 increased the levels of type III collagen (Col3) during the healing process and induced hair follicle formation, which is a characteristic of scar-less healing. Further investigation revealed that SFL-NT3 upregulated Col3 expression in skin fibroblasts expressing the NT3 receptor, TrkC. NT3 activation of TrkC leads to Akt phosphorylation, resulting in elevated Sox2 levels, which in turn enhances Col3 transcription. Notably, TrkC inhibition abrogated the beneficial effects of SF + SFL-NT3 on wound healing, confirming its involvement in this signaling pathway. In conclusion, the SF hydrogel loaded with SFL-NT3 facilitated rapid and reduced scarring during wound healing, providing a promising approach for the clinical treatment of SF-based biomaterials that incorporate bioactive factors.

Keywords: Neurotrophin-3; Scar; Silk fibroin hydrogel; Skin injury; Type III collagen.


Conflict of interest statement

The authors have no competing interests to declare.

Figures

Image 1
Graphical abstract
Fig. 1
Fig. 1
Fabrication and characterization of the SF + SFL-NT3 hydrogel. (A) The schematic diagram of SF + SFL-NT3 hydrogel preparation and its application in wound healing model. (B, a-b) The SEM photographs of SF + SFL-NT3 and the pore size analysis of hydrogels with different concentration, scale bar = 100 μm and 500 μm. Pore size analysis of the SF + SFL-NT3 hydrogel (n = 10). (C, a-b) Water contact angles of the SF + SFL-NT3 hydrogel with different concentration. Water contact angles analysis of the SF + SFL-NT3 hydrogel (n = 10). (D, a) NT3 release profile from the SF + SFL-NT3 hydrogel in PBS at different SF concentrations over 5 days (n = 3). (D, b) NT3 release profile from the SF + NT3 hydrogel and SF + SFL-NT3 hydrogel in PBS over 5 days (n = 3). Data were analyzed using one-way ANOVA followed by Tukey's post hoc test. P-values are presented in the figure. Statistical significance was set at P < 0.05.
Fig. 2
Fig. 2
SF + SFL-NT3 hydrogel promoted full-thickness wound healing in mice. (A) Schematic diagram illustrating the skin wound model and hydrogel treatment in mice. (B, a) Representative images of the wound area at days 0, 5, 10, 21, and 28 after injury in hydrogel-treated mice. (B, b) Statistical analysis of the wound area ratios for skin treated with different materials (n = 5 mice). (C, a-b) Representative images and statistical analysis of wound healing in PBS, SF, and SF + SFL-NT3-treated groups (n = 5 mice). Scale bar = 1 mm. (D, a-b) Representative images and statistical analysis of epithelial tongue length in treated wounds (n = 5 mice). Scale bar = 500 μm. Data were analyzed using one-way ANOVA followed by Tukey's post hoc test. Statistical significance was set at P < 0.05.
Fig. 3
Fig. 3
SF + SFL-NT3 promotes the synthesis of Col3 and accelerates hair follicle regeneration in mice. (A, a) Masson's Trichrome staining to visualize collagen deposition in tissue samples from PBS, SF, and SF + SFL-NT3 groups. Scale bar = 500 μm. (A, b) Quantitative analysis of collagen deposition by Masson's Trichrome staining. Data are expressed as means ± SE (n = 5 mice). (B, a-b) Representative H&E images of skin sections from PBS, SF, and SF + SFL-NT3 groups on days 5 and 28. Enlarged views of the boxed areas are shown on the right. Scale bars = 500 μm (left panel) and 200 μm (right panel). The blue lightning area indicates the initial damage zone. (B, c-d) Statistical analysis of regenerated hair follicles at the wound site. Data are expressed as means ± SE (n = 5 mice). (C, a) Representative immunofluorescence staining images showing Col1 (red) and DAPI (blue) in skin sections. Scale bar = 500 μm. (C, b) Statistical analysis of average fluorescence intensity of Col1. Data are expressed as means ± SE (n = 5 mice). (C, c) Representative immunofluorescence staining images of Col3 (red) and DAPI (blue) in skin sections. Scale bar = 500 μm. (C, d) Statistical analysis of average fluorescence intensity of Col3. Data are presented as mean ± SE (n = 5 mice). (D, a-b) Western blotting analysis of Col3 and Col1 expression in skin wounds treated with PBS and SF + SFL-NT3 hydrogel. β-actin was used as a control. Data are presented as means ± SE (n = 3). Data were analyzed using Student's t-test and one-way ANOVA followed by Tukey's post hoc test. P-values are presented in the figure. Statistical significance was set at P < 0.05. (For interpretation of the references to color in this figure legend, the reader is referred to the Web version of this article.)
Fig. 4
Fig. 4
Single-cell data analysis of skin fibroblasts. (A, a-b) UAMP plots colored by cell type from single-cell sequencing, where each dot represents an individual cell and different colors indicate different cell taxa. (A, c) Relative expression of Col3 across various cell types. (A, d) Expression of TrkC across various cell types. (B, a-b) Representative immunofluorescence staining images of skin sections from the back of mice in the SF + SFL-NT3 group. Arrows indicate co-labeled cells. Red indicates Col3, green indicates TrkC, and blue indicates DAPI. Scale bars = 500 μm (upper panel) and 200 μm (lower magnified panel). (For interpretation of the references to color in this figure legend, the reader is referred to the Web version of this article.)
Fig. 5
Fig. 5
SFL-NT3 regulates Col3 expression through activation of the TrkC/Akt/Sox2 pathway. (A). Representative Western blotting and statistical analysis of Col3 and Col1 expression after L929 cells were treated with SFL-NT3 recombinant protein. Col3 and Col1 values in the PBS group were normalized to 1. (n = 3) (B) Representative images and statistical analysis of immunofluorescence staining in L929 cells. Red indicates Col3. Scale bars = 10 μm. (n = 30; experiment repeated 3 times). (C) Representative Western blotting and statistical analysis of P-TrkC expression after L929 cells were treated with SFL-NT3 recombinant protein. P-TrkC values in the PBS group were normalized to 1. (n = 3) (D) Representative Western blotting and statistical analysis of P-Akt and Akt expression after L929 cells were treated with SFL-NT3 recombinant protein. P-Akt and Akt values in the PBS group were normalized to 1. (n = 3) (E) Representative Western blotting and statistical analysis of Sox2 expression after L929 cells were treated with SFL-NT3 recombinant protein. Sox2 values in the PBS group were normalized to 1. (F) Representative images and statistical analysis of immunofluorescence staining in L929 cells. Red indicates Sox2, and blue indicates DAPI. Scale bars = 10 μm. (n = 90; experiment repeated 3 times). Data are presented as mean ± SE. Statistical analysis was performed using Student's t-test. Data were analyzed using Student's t-test. P-values are presented in the figure. Statistical significance was set at P < 0.05. (For interpretation of the references to color in this figure legend, the reader is referred to the Web version of this article.)
Fig. 6
Fig. 6
Sox2 positively regulates Col3 expression. (A, a) The Jaspar database predicted Sox2, a transcription factor, to bind the Col3 gene via a specific binding site. (A, b) HEK-293T cells were transfected with either the Col3 promoter plasmid or the Col3 promoter plasmid along with pcDNA3.1-Sox2 for 48 h. Statistical analysis was performed using Student's t-test. Data are presented as the means ± SE (n = 3). (B, a) ChIP analysis demonstrated Sox2 enrichment in the Col3 promoter region, compared to the IgG promoter region. (B, b) Gel electrophoresis of qRT-PCR products showed Sox2 grayscale values exceeding those of IgG (n = 3). (C) Representative Western blotting and statistical analysis of Sox2 and Col3 levels following treatment of L929 cells with SFL-NT3 recombinant protein and the AKT inhibitor MK2206. β-actin served as the loading control. Sox2 and Col3 values in the DMSO-treated group were normalized to 1. Data are expressed as the means ± SE (n = 3). P-values are presented in the figure. (D) Representative Western blotting and statistical analysis of Col3 expression following Sox2 siRNA treatment in L929 cells. β-actin was used as the control. Col3 values in the Ctrl siRNA group were normalized to 1. Data are presented as mean ± SE (n = 3). P-values are presented in the figure. Data were analyzed using Student's t-test and one-way ANOVA followed by Tukey's post hoc test. Statistical significance was set at P < 0.05.
Fig. 7
Fig. 7
TrkC inhibitors suppress Col3 synthesis in vivo. (A) Schematic representation of skin wound and hydrogel treatment protocols. (B, a) Representative images of wound areas following different treatments on days 0 and 5 post-injury. (B, b) Wound area ratios at different time points for treatments with various materials (n = 5 mice). (C, a) Representative HE staining images of skin sections from DMSO, SF + SFL-NT3, and SF + SFL-NT3+LPM4870108 groups. Enlarged regions are shown on the right. Scale bars = 500 μm (left panel) and 200 μm (right panel). (C, b) Statistical analysis of regenerated hair follicles at the wound site. Data are presented as means ± SE (n = 5). (D, a) Representative immunofluorescence images of skin sections. Red indicates Col1, and blue indicates DAPI. Scale bars = 500 μm. (D, b) Statistical analysis of average fluorescence intensity of Col1. Data are expressed as means ± SE (n = 5). (E, a) Representative immunofluorescence staining images of skin sections from the back of mice. Red indicates Col3, and blue indicates DAPI. Scale bars = 500 μm. (E, b) Statistical analysis of the average fluorescence intensity of Col3. Data are expressed as mean ± SE (n = 5). Data were analyzed using one-way ANOVA followed by Tukey's post hoc test. P-values are presented in the figure. Statistical significance was set at P < 0.05. (For interpretation of the references to color in this figure legend, the reader is referred to the Web version of this article.)
Fig. 8
Fig. 8
Schematic illustration of SF + SFL-NT3 hydrogel production and its application in promoting scarless skin injury recovery. The SF + SFL-NT3 hydrogel is self-assembled from SF and SFL-NT3 to form SFH-SFL-NT3. This hydrogel material enhances skin repair with minimal scarring by stimulating neuronal axon growth and type III collagen deposition in fibroblasts.

Similar articles

Cited by

References

    1. Chen S., et al. Mechanically and biologically skin-like elastomers for bio-integrated electronics. Nat. Commun. 2020;11:1107. doi: 10.1038/s41467-020-14446-2. - DOI - PMC - PubMed
    1. Gu Y., Han J., Jiang C., Zhang Y. Biomarkers, oxidative stress and autophagy in skin aging. Ageing Res. Rev. 2020;59 doi: 10.1016/j.arr.2020.101036. - DOI - PubMed
    1. Qu F., Geng R., Liu Y., Zhu J. Advanced nanocarrier- and microneedle-based transdermal drug delivery strategies for skin diseases treatment. Theranostics. 2022;12:3372–3406. doi: 10.7150/thno.69999. - DOI - PMC - PubMed
    1. Martin P. Wound healing--aiming for perfect skin regeneration. Science. 1997;276:75–81. doi: 10.1126/science.276.5309.75. - DOI - PubMed
    1. Tan N.S., et al. The nuclear hormone receptor peroxisome proliferator-activated receptor beta/delta potentiates cell chemotactism, polarization, and migration. Mol. Cell Biol. 2007;27:7161–7175. doi: 10.1128/MCB.00436-07. - DOI - PMC - PubMed

LinkOut - more resources