. 2025 Jun 24;4(6):pgaf173.
doi: 10.1093/pnasnexus/pgaf173. eCollection 2025 Jun.

Global analysis of constraints to natural climate solution implementation

Affiliations

Global analysis of constraints to natural climate solution implementation

Hilary Brumberg et al. PNAS Nexus. .

Abstract

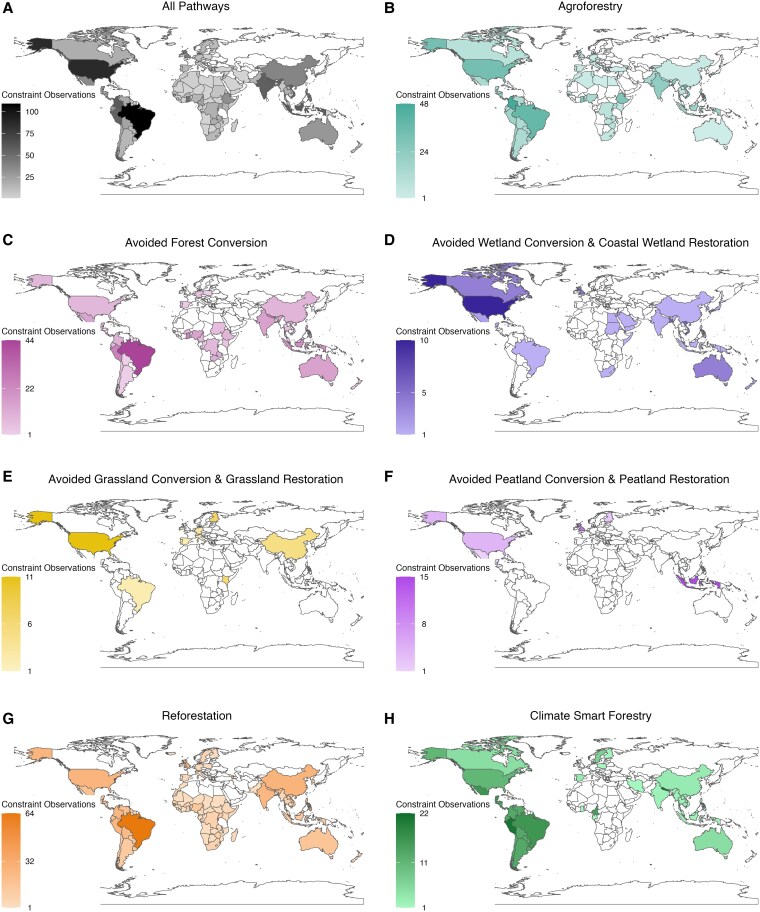
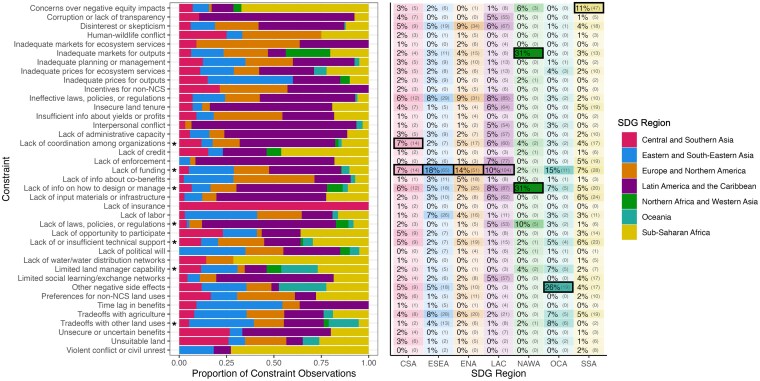
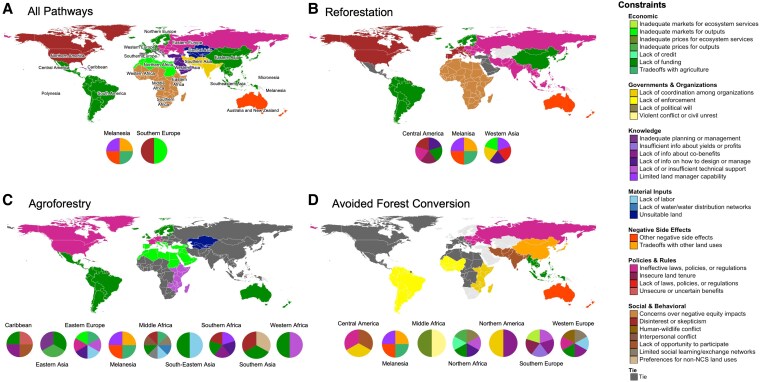
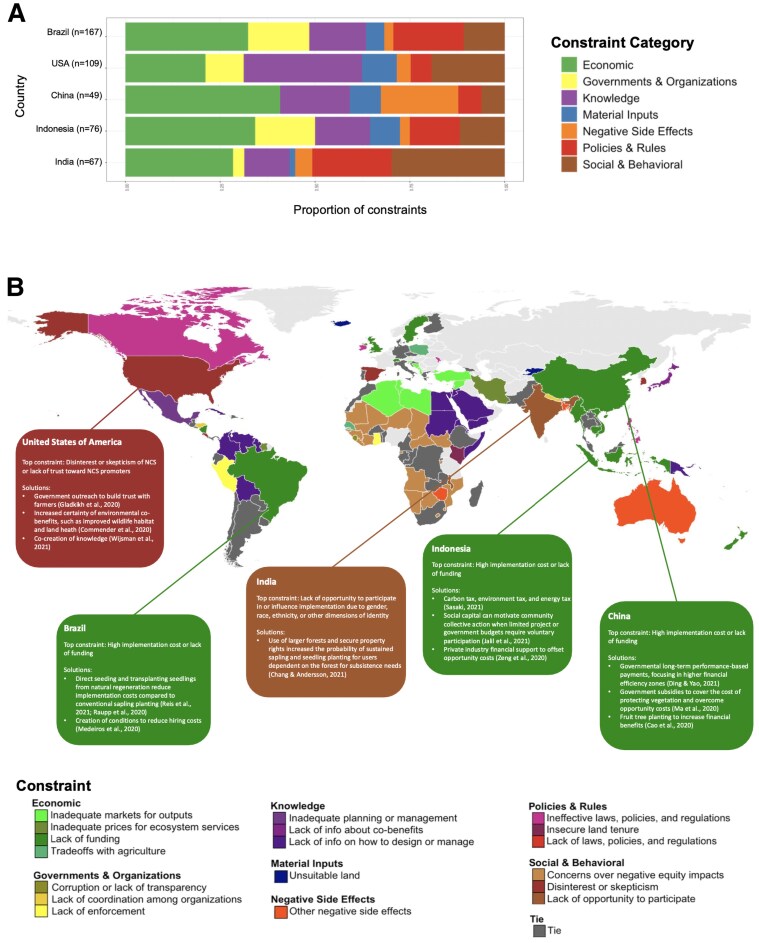
Natural climate solutions (NCS) could provide over one-third of the climate mitigation needed between now and 2030 to limit warming below 2°C and support the Sustainable Development Goals. However, large disparities persist between the estimated biophysical climate mitigation potential (CMP) of NCS and their actual implementation. Social, political, informational, and economic factors contribute to this gap, but the spatial distribution of these constraints and their impacts on different NCS pathways remains poorly understood. Understanding these constraints is especially important due to the large uncertainties in NCS CMP and growing research on spatial prioritization of NCS, often based only on biophysical criteria. We identified and mapped nonbiophysical constraints to NCS implementation efficacy by conducting a systematic review of recent peer-reviewed literature across 10 high-CMP NCS pathways. From 1,821 papers, we identified 352 that provided 2,480 observations of 39 unique constraints from 135 countries. We mapped the spatial distribution of these constraints and analyzed patterns across NCS pathways and geographic classifications. Lack of funding, insufficient information on NCS management, and ineffective policies emerged as the most common constraints globally. However, each pathway and geography faced a distinct suite of interrelated constraints spanning multiple categories. These findings highlight the need for context-specific, equitable solutions, likely requiring transdisciplinary approaches and cross-sectoral collaborations. The results could also help increase accuracy of NCS CMP estimates. We discuss how adaptive management may be used for NCS initiatives at any scale to proactively diagnose co-occurring constraints at each implementation phase and to develop integrated, place-based solutions.

Keywords: Sustainable Development Goals; climate change; conservation; nature-based climate solutions; spatial analysis.


Figures

Fig. 1.
Fig. 1.
Pathway constraint evidence map. Number of constraints observed in each country A) across all 10 NCS pathways and for the following pathways: B) agroforestry, C) avoided forest conversion, D) avoided wetland conversion and coastal wetland restoration, E) avoided grassland conversion and grassland restoration, F) avoided peatland conversion and peatland restoration, G) reforestation, and H) climate-smart forestry.
Fig. 2.
Fig. 2.
Constraint frequency and co-occurrence. A) Number of observations of each constraint, organized by constraint category. B) Co-occurrence frequency—network graph illustrating constraints that most commonly co-occurred within a UN subregion, based on the highest Jaccard similarity. Nodes represent individual constraints, color-coded by category. Connectors indicate the strength of co-occurrence measured using the Jaccard similarity index, with thicker lines indicating stronger co-occurrence. The visualization represents pairwise relationships between constraints, not clusters. C) Number of constraint observations in each constraint category.
Fig. 3.
Fig. 3.
Constraints by NCS pathway. Pathways are avoided forest conversion (AFC), avoided grassland conversion and grassland restoration (AGC/GrR), agroforestry (AgFo), avoided peatland conversion and peatland restoration (APC/PeR), avoided wetland conversion and coastal wetland restoration (AWC/CWR), climate-smart forestry, and reforestation (RFo). Left: Share of NCS pathways in the frequency count of each constraint. For example, RFo accounted for 85.7% of instances of “Concerns over negative equity impacts.” Right: Frequency distributions of constraints by NCS pathway. Shading corresponds to the share of each constraint in the total constraint frequency count of each pathway. Black boxes indicate the most frequently reported constraint for each pathway. For example, “Lack of funding” was observed 39 times for AFC, representing 10% of the constraint share for AFC, the most frequent constraint for this pathway. Asterisks indicate constraints observed in all seven pathways.
Fig. 4.
Fig. 4.
Constraints by SDG region. SDG regions are Central and Southern Asia (CSA), Eastern and South-Eastern Asia, Europe and Northern America, Latin America and Caribbean, Northern Africa and Western Asia (NAWA), Oceania (OCA), and Sub-Saharan Africa (SSA). Left: Percent breakdown of constraint observations by SDG region. For example, 61.7% of instances of “Concerns over negative equity impacts” were found in SSA. Right: Percent share and frequency of each constraint within each SDG region. Shading indicates the share of each constraint in total constraint count in a region. Black boxes indicate the most frequent constraint in each SDG region (two constraints were tied for CSA and NAWA). For example, “Negative equity impacts” was observed 47 times in SSA, representing 11% of total constraint observations in SSA, the most frequent constraint reported for this SDG region. Asterisks indicate constraints observed in all seven SDG regions.
Fig. 5.
Fig. 5.
Most frequently identified constraint(s) in each UN subregion for all pathways A), and separately for the three pathways with the most observations in our dataset (together accounting for 79.0% of all observations): B) reforestation, C) agroforestry, and D) avoided forest conversion. Countries are colored on the map based on the most frequently identified constraint in their subregion. Subregions where multiple constraints were tied for the most frequently identified are shown in dark gray on the map and have pie charts below showing the tied top constraints. Subregions where no data were available for that pathway are shown in light gray.
Fig. 6.
Fig. 6.
A) Breakdown of constraint categories of constraints observed for the five countries with the highest NCS CMP globally. Parentheses indicate the number of constraint observations for each country. B) The most commonly identified constraint in each country. Dark gray indicates ties. Light gray indicates no data. Boxes show solutions identified in the literature review for the five countries with the highest CMP (23, 34–45).

References

    1. Griscom BW, et al. 2017. Natural climate solutions. Proc Natl Acad Sci U S A. 114:11645–11650. - PMC - PubMed
    1. Ellis PW, et al. 2024. The principles of natural climate solutions. Nat Commun. 15:547. - PMC - PubMed
    1. Chausson A, et al. 2020. Mapping the effectiveness of nature-based solutions for climate change adaptation. Glob Chang Biol. 26:6134–6155. - PubMed
    1. Seddon N, et al. 2021. Getting the message right on nature-based solutions to climate change. Glob Chang Biol. 27:1518–1546. - PubMed
    1. Seddon N. 2022. Harnessing the potential of nature-based solutions for mitigating and adapting to climate change. Science. 376:1410–1416. - PubMed

LinkOut - more resources