. 2025 Jun 6;4(6):pgaf189.
doi: 10.1093/pnasnexus/pgaf189. eCollection 2025 Jun.

Biophysical basis of tight junction barrier modulation by a pan-claudin-binding molecule

Affiliations

Biophysical basis of tight junction barrier modulation by a pan-claudin-binding molecule

Chinemerem P Ogbu et al. PNAS Nexus. .

Abstract

Claudins are a 27-member family of membrane proteins that form and fortify specialized cell contacts in endothelium and epithelium called tight junctions. Tight junctions restrict paracellular transport through tissues by forming molecular barriers between cells. Claudin-binding molecules thus hold promise for modulating tight junction permeability to deliver drugs or as therapeutics to treat tight junction-linked disease. The development of claudin-binding molecules, however, is hindered by their physicochemical intractability and small targetable surfaces. Here, we determine that a synthetic antibody fragment (sFab) that we developed binds with nanomolar affinity directly to 10 claudin subtypes and other distantly related claudin family members but not to other tight junction-localized membrane proteins. It does so by targeting the extracellular surfaces of claudins, which we verify by applying this sFab to a model intestinal epithelium and observe that it opens paracellular barriers comparable to a known, but application limited, tight junction modulating protein. This pan-claudin-binding molecule holds potential for both basic and translational applications as it is a probe of claudin and tight junction structure in vitro and in vivo and a tool to modulate the permeability of tight junctions broadly across tissue barriers.

Keywords: claudin; drug delivery; membrane proteins; synthetic antibody; tight junctions.


Figures

Fig. 1.
Fig. 1.
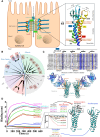
Sequence, structure, and function classification of claudins. A) Model epithelial bicellular tight junction with zoom-in depicting the 3D structures of claudins. Claudins are colored N terminus (blue) to C terminus (red) and domains of interest are labeled as follows: TM domain, ECS, intracellular loop (ICL), and extracellular helix (ECH). B) Phylogenetic tree of the claudin family highlighting classic vs. nonclassic subtypes and subtypes used in this study (pink box). C) The three known COP-1-binding epitopes on claudins. Sequence alignment of the 13 claudins used in this study with epitopes highlighted (orange box) and arranged in order of sequence identity to hsCLDN-4 COP-1 epitope from highest to lowest. Also shown is the structure of COP-1 (blue) bound the hsCLDN-4 (cyan) with epitopes 1–3 shown (orange). D) Binding of claudins to cCpE from BLI. Association and dissociation phases are 300 s each. Zoom-in shows binding experiment with claudin nonreceptors. Grouping of claudins into three categories based on cCpE receptor capacity from this experiment is shown in relation to structures of claudins alone or claudin/cCpE complexes.
Fig. 2.
Fig. 2.
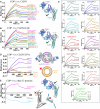
COP-1 interactions with claudins and other tight junction proteins. A) Single-concentration point assessment of COP-1 binding to 13 claudin subtypes at 500 nM and B) single-concentration point analysis of COP-1 binding to 13 claudin subtypes in the presence of cCpE (250/250 nM). Table 1 shows the associated KDs values. C) Full multiconcentration point (0–500 nM) analyses of COP-1 binding to 11 representative claudin subtypes, and D) multiconcentration point (0–500 nM) analyses of COP-1 binding to SUVs loaded or unloaded with hsCLDN-4. Table 2 shows the associated kinetic rates and KDs values. E) Single-concentration point analysis of COP-1 binding to a control claudin (mmCLDN-4), human occludin, and JAM-A at 500 nM.
Fig. 3.
Fig. 3.
COP-1 interactions with distantly related claudin/PMP22/EMP22/MP20 family members. A) Models from AlphaFold of hsMP-20 (yellow), hsPMP-22 (purple), ciCLDN-16 (salmon), and dmKune (brown) were superimposed on the experimental structure of hsCLDN-4 (teal). The cryo-EM structure of COP-1 bound to hsCLDN-4/cCpE (PDB ID 8u4v) shows a potentially shared mode of COP-1 binding to these four proteins. B) Full multiconcentration point (0–800 nM) analyses of COP-1 binding to claudin homologs. Colors of binding traces match structures in A). C) Zoom-in of epitopes 1 and 3 on claudins and claudin-like proteins where COP-1 likely binds based on BLI results and cryo-EM structure PDB ID 8u4v.
Fig. 4.
Fig. 4.
Effect of COP-1 on tight junction barrier integrity in a model for intestinal epithelium. A) Plot of relative TEER measurements using an STX electrode after delivery of various proteins to the apical or basolateral compartments of Caco-2 monolayers. Proteins include cCpE, COP-1, COP-2, and CpE. TEER was measured n = 2 for cCpE basolateral and COP-2 apical treatments and measured n = 3 for buffer, COP-1 apical and basolateral, cCpE, and CpE apical treatments. B) Plot of relative TEER measurements using an Ussing chamber from the same monolayers used in A). TEER was measured n = 2 for all concentrations. C) COP-1 concentration-dependent decrease in TEER. A concentration range (0–9,000 nM) of COP-1 was added to apical compartments and single concentration (500 nM) added to basolateral compartments of Caco-2 cells, and TEER was measured using a STX electrode, n = 3. The recovery of barrier function was measured after removal of COP-1. Solid bars represent the data from 24 h, while patterned bars represent the data from 48 h (that is 24 h after COP-1-containing media are exchanged with fresh medium), n = 3. The 48-h timepoint for 9 µM COP-1 apical measurement was not determined (N/D). There is no significant difference between the cells before treatment and after recovery. All data are represented as mean ± SEM of two or three independent measurements. *P < 0.05 and **P < 0.001 in TEER from treated cells compared with buffer alone.
Fig. 5.
Fig. 5.
Structural basis of COP-1 binding to claudins. A) SEC chromatograms showing the elution times of claudins alone (dashed lines) vs. claudin/COP-1/Nb complexes (solid lines). Structural models of the expected complexes are shown based on PDB ID 8u4v where claudins and COP-1 are depicted as cartoons. B) 2D classifications and C) 3D reconstructions from cryo-EM of claudin/COP-1/Nb complexes from the three cCpE receptor classes (receptors, black; nonreceptors, blue; partial receptors, red). Note that the quality of 2D classes and final maps varies and that all three maps in C) have been contoured to a level (0.09) optimized for receptor claudins to highlight differences in quality.

Update of

Similar articles

References

    1. Tsukita S, Tanaka H, Tamura A. 2019. The claudins: from tight junctions to biological systems. Trends Biochem Sci. 44:141–152. - PubMed
    1. Krause G, et al. 2008. Structure and function of claudins. Biochim Biophys Acta. 1778:631–645. - PubMed
    1. Hewitt KJ, Agarwal R, Morin PJ. 2006. The claudin gene family: expression in normal and neoplastic tissues. BMC Cancer. 6:186. - PMC - PubMed
    1. Koval M. 2013. Differential pathways of claudin oligomerization and integration into tight junctions. Tissue Barriers. 1:e24518. - PMC - PubMed
    1. Lal-Nag M, Morin PJ. 2009. The claudins. Genome Biol. 10:235. - PMC - PubMed

LinkOut - more resources