. 2025 Jun 24;4(6):pgaf175.
doi: 10.1093/pnasnexus/pgaf175. eCollection 2025 Jun.

Improving predictability, reliability, and generalizability of brain-wide associations for cognitive abilities via multimodal stacking

Affiliations

Improving predictability, reliability, and generalizability of brain-wide associations for cognitive abilities via multimodal stacking

Alina Tetereva et al. PNAS Nexus. .

Abstract

Brain-wide association studies (BWASs) have attempted to relate cognitive abilities with brain phenotypes, but have been challenged by issues such as predictability, test-retest reliability, and cross-cohort generalizability. To tackle these challenges, we proposed a machine learning "stacking" approach that draws information from whole-brain MRI across different modalities, from task-functional MRI (fMRI) contrasts and functional connectivity during tasks and rest to structural measures, into one prediction model. We benchmarked the benefits of stacking using the Human Connectome Projects: Young Adults (n = 873, 22-35 years old) and Human Connectome Projects-Aging (n = 504, 35-100 years old) and the Dunedin Multidisciplinary Health and Development Study (Dunedin Study, n = 754, 45 years old). For predictability, stacked models led to out-of-sample r∼0.5-0.6 when predicting cognitive abilities at the time of scanning, primarily driven by task-fMRI contrasts. Notably, using the Dunedin Study, we were able to predict participants' cognitive abilities at ages 7, 9, and 11 years using their multimodal MRI at age 45 years, with an out-of-sample r of 0.52. For test-retest reliability, stacked models reached an excellent level of reliability (interclass correlation > 0.75), even when we stacked only task-fMRI contrasts together. For generalizability, a stacked model with nontask MRI built from one dataset significantly predicted cognitive abilities in other datasets. Altogether, stacking is a viable approach to undertake the three challenges of BWAS for cognitive abilities.

Keywords: cognitive abilities; generalizability; reliability; stacking; task fMRI.


Figures

Fig. 1.
Fig. 1.
Overview of study methodology. We used three datasets: HCP Young Adults, HCP Aging, and Dunedin Multidisciplinary Health and Development Study (Dunedin Study). a) Machine Learning Pipeline. Here, we depict the process we used for building prediction models for testing predictability within each dataset. Briefly, we used nested cross-validation (CV) by splitting the data into outer folds with around 100 participants in each. In each outer-fold CV loop, we then treated one of the outer folds as an outer-fold test set and treated the rest as an outer-fold training set. We then divided each outer-fold training set into five inner folds and applied inner-fold CV to build prediction models in three steps. In the first step (known as a nonstacking layer), one of the inner folds was treated as an inner-fold validation set, and the rest was treated as an inner-fold training set in each inner-fold CV. We used grid search to tune prediction models for each set of features. In the second step (known as a stacking layer), we treated different combinations of the predicted values from separate sets of features as features to predict the cognitive abilities in separate “stacked” models. In the third step, we applied the already tuned models from the first and second steps to the outer-fold test set. b) Predictability. Here, we examined the predictive performance across outer-fold test sets within each dataset. c) Test–retest reliability. Here, we used HCP Young Adults and Dunedin Study and treated participants who were scanned twice across MRI sessions as the test set and the rest as the training set. We then examined the ICC of the predicted values in the test set between the first and second MRI sessions. d) Generalizability. Here, we examined the predictive performance of the models built from a different dataset. We treated one of the three datasets as a training set and the other two as two separate test sets. e) Age distribution. Here, we show the age of participants at the time of scanning in each dataset.
Fig. 2.
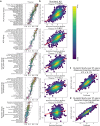
Fig. 2.
Predictability of stacked and nonstacked models. a) Pearson's correlation (r) of stacked and nonstacked models for each dataset with Elastic Net across the two layers. Higher is better. Each dot represents predictive performance at each outer-fold test set. For other algorithms and other performance indices, the coefficient of determination (R2), and MAE, see Figs. S1–S9. For Dunedin Study, childhood scores reflect cognitive abilities, averaged across 7, 9, and 11 years old, and negative residual scores reflect a stronger decline in cognitive abilities, as expected from childhood cognitive abilities, compared with participants' peers. b) Dense scatter plot illustrating observed and predicted cognitive abilities (Z scores) using Stacked-All models with Elastic Net across two layers. Stacked All include all sets of MRI features. c) Observed cognitive abilities at ages 7, 9, and 11 years compared with age 45 years from the Dunedin Study. The ICC reflects the strength of the relationship in the observed cognitive ability scores between these time points. d) Predicted cognitive abilities at ages 7, 9, and 11 years compared with age 45 years from the Dunedin Study. Pearson's correlation reflects the strength of the relationship in the predicted cognitive ability scores between these time points. The predicted cognitive ability scores at each of the two time points were trained from the same set of neuroimaging features via the Stacked-All models, albeit with different targets (either the cognitive abilities averaged across ages 7, 9, and 11 years or cognitive abilities at age 45 years). This is because MRI data were only collected at age 45 years, while cognitive abilities were collected at both time points. Accordingly, it is expected that the ICC of the observed cognitive ability scores will be higher than the Pearson's correlation of the predicted cognitive ability scores. XGB, XGBoost.
Fig. 3.
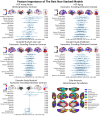
Fig. 3.
Feature importance of the top-performing nonstacked models with Elastic Net, as indicated by Elastic Net coefficients. We grouped brain ROIs from the Glasser atlas (67) into 13 networks based on the Cole-Anticevic brain networks (66). In each figure, the networks are ranked by the mean Elastic Net coefficients, with the rankings shown to the right of each figure. The network partition illustration is sourced from the Actflow Toolbox https://colelab.github.io/ActflowToolbox/. We provide actual values of the feature importance in Tables S1–S10.
Fig. 4.
Fig. 4.
Test–retest reliability of the predicted values of the stacked and nonstacked models, indicated by ICC for HCP Young Adults and Dunedin Study. Left panel: Each dot represents ICC, while each bar represents a 95% CI. Right panel: Predicted values of some stacked models across two scanning sessions. Each line represents each participant. Lines would be completely parallel with each other in the case of perfect test–retest reliability. For other stacked and nonstacked models, see Figs. S33 and S34.
Fig. 5.
Fig. 5.
Generalizability and similarity in predicted values among the three datasets, as indicated by Pearson's correlation, r. Note that due to the different tasks used in different datasets, we only examined the generalizability of prediction models built from nontask sets of features (including rest FC, cortical thickness, cortical surface area, subcortical volume, total brain volume, and their combination, or “Stacked: Non Task”). For generalizability, the off-diagonal values reflect the level of generalizability from one dataset to another, while the diagonal values reflect the predictability of the models built from the same dataset via nested CV. For the similarity in predicted values, the off-diagonal values reflect the level of similarity in predicted values between two datasets. Higher values are better. The values in square blankets reflect a bootstrapped 95% CI. If 95% CI did not include 0, then generalizability/similarity in predictive values was better than chance. HCP-YA, HCP Young Adults; HCP-A, HCP Aging; DUD, Dunedin Study.

Update of

Similar articles

References

    1. Deary IJ, Pattie A, Starr JM. 2013. The stability of intelligence from age 11 to age 90 years: the Lothian Birth Cohort of 1921. Psychol Sci. 24:2361–2368. - PubMed
    1. Tucker-Drob EM, Briley DA. 2014. Continuity of genetic and environmental influences on cognition across the life span: a meta-analysis of longitudinal twin and adoption studies. Psychol Bull. 140:949–979. - PMC - PubMed
    1. Deary IJ, Strand S, Smith P, Fernandes C. 2007. Intelligence and educational achievement. Intelligence. 35:13–21.
    1. Schmidt FL, Hunter J. 2004. General mental ability in the world of work: occupational attainment and job performance. J Pers Soc Psychol. 86:162–173. - PubMed
    1. Llewellyn DJ, Lang IA, Langa KM, Huppert FA. 2008. Cognitive function and psychological well-being: findings from a population-based cohort. Age Ageing. 37:685–689. - PMC - PubMed

LinkOut - more resources