. 2025 May 14:12:rbaf040.
doi: 10.1093/rb/rbaf040. eCollection 2025.

Enhanced prevention on postoperative atrial fibrillation by using anti-inflammatory biodegradable drug patch

Affiliations

Enhanced prevention on postoperative atrial fibrillation by using anti-inflammatory biodegradable drug patch

Pengcheng Yu et al. Regen Biomater. .

Abstract

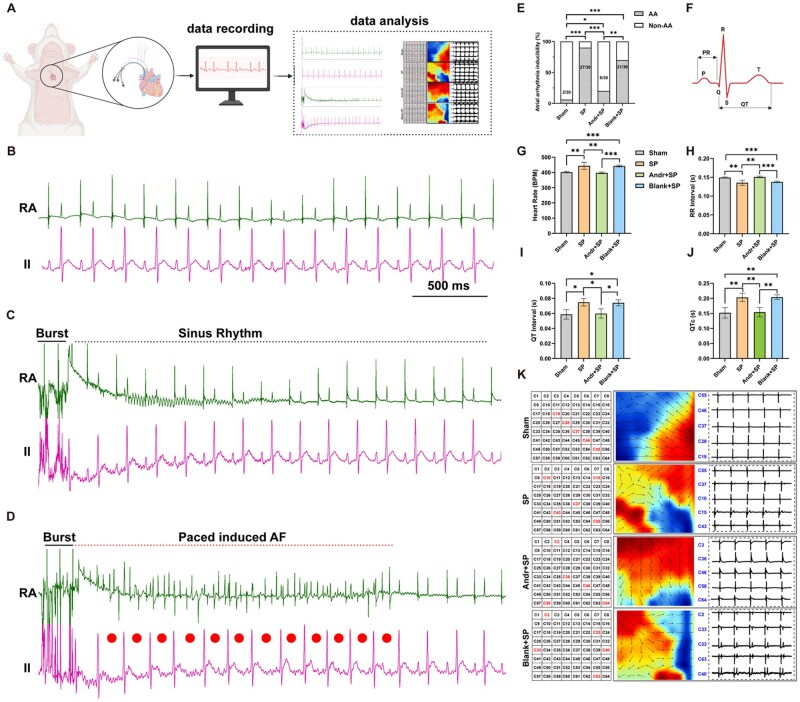
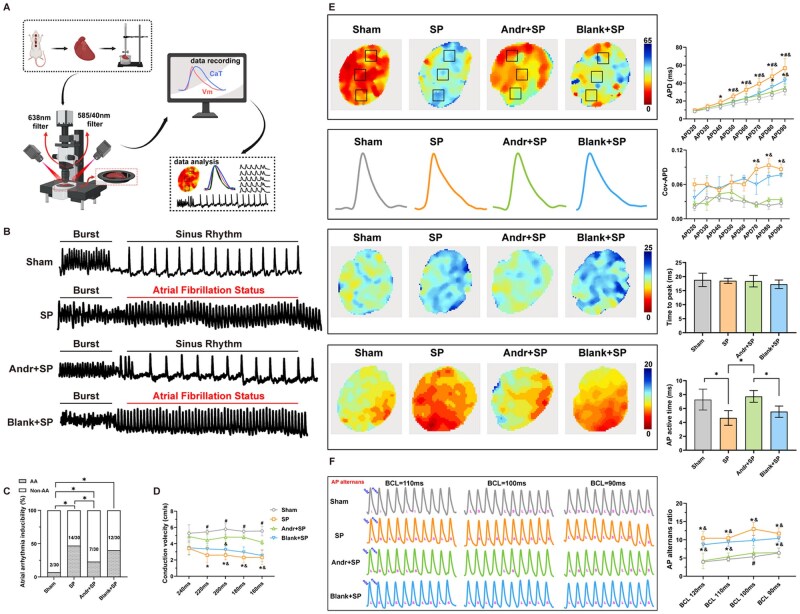
Postoperative atrial fibrillation (POAF) is the most prevalent form of secondary atrial fibrillation and increases the risk of adverse cardiovascular outcomes, such as stroke, heart failure and increased mortality. Herein, we designed an andrographolide (Andr)-loaded degradable polymer patch to deliver the drug directly to the atrial tissue for prevention of POAF. The sterile pericarditis (SP) rat model was adopted for highly relationship to clinical practice. The patch-released Andr effectively reduced the incidence of atrial fibrillation from 90 to 20%, and alleviated local atrial inflammation and oxidative stress in vivo, by using electrophysiological detection and histological analysis such as immunofluorescence, western blot and PCR. In HL-1 cells, we found the use of Andr-loaded patch could strongly inhibit the cell death, reactive oxygen species (ROS) generation and mitochondrial injury caused by LPS. Meanwhile, the use of Andr-loaded patch could effectively inhibited macrophages polarize towards M1. Mechanistically, we verified that the regulation of the cytoplasm and mitochondria Ca2+ and ROS dynamic balance was quite important both in vivo and in vitro. Our strategy proved by regulating the inflammatory microenvironment, ROS balance and Ca2+ homeostasis and the Andr-loaded atrial patch was effective for POAF in the SP rat model. The electrical signal of atrial stromal reentry in the case of this model was successfully mined, and the results of calcium channel were basically consistent with that of electrical signal channel. In addition, we have reported the infiltration and polarization of local inflammatory cells in the atrial of POAF at the tissue section level. Our study served as a new inspiration for the treatment of arrhythmic diseases and other ROS- and Ca2+- associated local illnesses.

Keywords: andrographolide; drug-eluting patch; inflammation; oxidative stress; postoperative atrial fibrillation.


Figures

None
Graphical abstract
Figure 1.
Figure 1.
Fabrication of the patch. (A) Schematic illustration of patch fabrication and application. (B) Synthesis of PEL triblock copolymers and characterization of physical properties detection. Fabrication of drug-loaded atrial patch synthesis. 1H-NMR spectrum (C, D) and GPC spectrum (E) of PEL triblock copolymers. (F)The digital photo of the atrial patch. (G, H) Surface cross-sectional and SEM micrographs of the atrial patch. (I) The fluorescence microscopy image of the distribution of RITC-labeled Andr within the patch. (J) The stress–strain curve of the atrial patch. (K) Modulus of the atrial patch at different temperatures (DMA). (L) Concentration standard curve for Andr at a fixed wavelength peak (226 nm). (M) In vitro drug release profiles of Andr-loaded atrial patch. (N) Schematic diagram of the rat model and the patch attached to the left atrium. Retrieve from https://app.biorender.com/biorender-templates.
Figure 2.
Figure 2.
Andr-loaded patch treatment reduces AF vulnerability in vivo. (A) Diagram of invasive electrophysiological measurement and AF vulnerability detection in vivo. (B) Typical surface ECG (lead II) and intracavitary electrical signal recordings before burst pacing (in sinus rhythm). (C, D) representative simultaneous recordings of surface ECG (lead II) and intracardiac electrograms in rats without or with successfully induced AF. (E) Incidence of pacing-induced AF in rats (n = 6, each rat was measured 5 times). (F) Demonstration of various indicators of electrocardiogram. (G) Quantification of heart rate (n = 6). (H) Quantification of RR interval (n = 6). (I) Quantification of QT interval (n = 6). (J) Quantification of QTc (n = 6). (K) Representative electrical propagation heat map located on the left atrium. Data are shown as mean ± standard deviation (SD) and statistical analysis was performed with one-way ANOVA statistic test. *P < 0.05, **P < 0.01 and ***P < 0.001 indicate statistical significance between paired groups.
Figure 3.
Figure 3.
Effect of Andr-loaded patch on the atrial repolarization characteristic from the Vm channel. (A) Diagram of the ex vivo optical mapping process. (B) Representative simultaneous recordings located on the left atrial epicardium without or with success fully induced AF. (C) The inducibility of atrial arrhythmia induced by burst pacing of four groups; *P < 0.05 indicates statistical significance between paired groups (n = 6, each rat heart was measured 5 times). (D) Quantitative statistics of atrial conduction velocities among different S1–S1 intervals from 240 ms to 160 ms, *P < 0.05 vs. Sham group; #P < 0.05 vs. blank-loaded group; &P < 0.05 vs. Andr-loaded group. (E) Representative heatmaps and trajectories of APD80 among four groups, *P < 0.05 vs. Sham group (n = 6); #P < 0.05 vs. blank-loaded group (n = 6); &P < 0.05 vs. Andr-loaded group (n = 6); representative time to peak maps and typical action time heatmaps on AP channel of four groups; quantitative analysis of APD differences from APD20 to APD90 and its COV, *P < 0.05 vs. control group (n = 6); &P < 0.05 vs. Andr-loaded group (n = 6); statistic analysis of peak maps on AP channel. *P < 0.05 indicates statistical significance between paired groups (n = 6). (F) Representative AP alternans among four groups at different S1S1 pacing intervals; quantitative calculations of AP alternans ratio among four groups, *P < 0.05 vs. Sham group (n = 6); &P < 0.05 vs. Andr-loaded group (n = 6); data are shown as mean ± standard deviation (SD) and statistical analysis was performed with one-way ANOVA statistic test.
Figure 4.
Figure 4.
Andr-loaded patch treatment attenuated atrial inflammation in vivo and in vitro. (A) Representative images of hematoxylin-eosin (HE) staining. (B) Representative images of M1 macrophage polarization in the atrial of each group. M1 macrophage was labeled by inos positive together with CD68 positive. (C) Quantitative analysis of the proportion of M1 macrophage (n = 3). (D) Quantitative analysis of the expression of TNF-α and IL-1β (n = 3). (E) Diagram of the isolation and simulation of the BMDMs. (F) Representative images of propidium iodide (PI)-positive apoptotic BMDMs determined by flow cytometry. Quantitative analysis of the PI-positive apoptotic BMDMs (n = 3). (G) Representative images of the CD86-positive BMDMs determined by flow cytometry. Quantitative analysis of the CD86-positive BMDMs (n = 3). (H) TNF-α levels in BMDMs medium determined by ELISA (n = 3). (I) Representative images of ROS level in BMDMs using DCFH-DA probe (n = 3). Quantitative analysis of the DCF fluorescence density. Data are shown as mean ± standard deviation (SD), and statistical analysis was performed with one-way ANOVA statistic test. *P < 0.05, **P < 0.01 and ***P < 0.001 indicate statistical significance between paired groups.
Figure 5.
Figure 5.
Andr-loaded patch treatment alleviated oxidative stress injury in vivo and in vitro. (A) Representative dihydroethidium (DHE) fluorescence images of superoxide production in rats. (B) Quantitative analysis of the fluorescence density of DHE (n = 3). (C) Representative blots of heme oxygenase-1 (HMOX1), NQO1, SOD1 and SOD2. (D) Quantitative analysis of the expression of HMOX1, NQO1 and SOD2 (n = 3). (E) qPCR was carried out to determine the mRNA levels of HMOX1, NQO1 (data were normalized to GAPDH, n = 3). (F) Representative images of DCFH-DA HL-1 cell determined by flow cytometry. (G) Representative Fluo4 fluorescence images of Ca2+ and JC-1 mitochondrial membrane potential (MMP) assay in HL-1 cells. (H) Quantitative analysis of the fluorescence density of DCF, Fluo4 and JC-1 (n = 3). Data are shown as mean ± standard deviation (SD), and statistical analysis was performed with one-way ANOVA statistic test. *P < 0.05, **P < 0.01 and ***P < 0.001 indicate statistical significance between paired groups.
Figure 6.
Figure 6.
Effect of Andr-loaded patch on the atrial calcium handling capabilities, the arrhythmogenic alternans and re-entry ex vivo. (A) Representative heatmaps and trajectories of CaD80 among four groups, *P < 0.05 vs. Sham group (n = 6); #P < 0.05 vs. blank-loaded group (n = 6); &P < 0.05 vs. Andr-loaded group (n = 6); representative time to peak maps and typical action time heatmaps on Ca2+ channel of four groups; quantitative analysis of CaD differences from CaD20 to CaD90 and its COV, *P < 0.05 vs. control group (n = 6); &P < 0.05 vs. Andr-loaded group (n = 6); statistic analysis of peak maps on Ca2+ channel. *P < 0.05 indicates statistical significance between paired groups (n = 6). (B) Representative Ca2+ alternans among four groups at different S1S1 pacing intervals; quantitative calculations of Ca2+ alternans ratio among four groups, *P < 0.05 vs. Sham group (n = 6); &P < 0.05 vs. Andr-loaded group (n = 6); (C) Representative schematic diagrams of S2 induction (showed in the dashed box) after five consecutive S1 stimuluses in four groups; calculation of the recovery ratio of CaT ratio among four groups and its statistical analysis for the COV-recovery of CaT ratio, *P < 0.05 vs. Sham group (n = 6); #P < 0.05 vs. blank loaded group (n = 6); &P < 0.05 vs. Andr-loaded group (n = 6); (D) The acquirements of S2/S1 CaT amplitudes from the incipient 100 ms-S1S2 interval with a incrementally stepwise S1-S2 interval; quantitative statistics of the S2/S1 amplitude ratio among four different sites of atrium of each group, *P < 0.05 vs. Sham group (n = 6); #P < 0.05 vs. blank-loaded group (n = 6); &P < 0.05 vs. Andr-loaded group (n = 6). (E) Typical phase images of dynamic re-entry phenomenon on AP channel. Data are shown as mean ± standard deviation (SD), and statistical analysis was performed with one-way ANOVA statistic test.
Figure 7.
Figure 7.
Therapeutic effect of Andr-patch on POAF by regulating the ROS balance and Ca2+. Retrieve from https://app.biorender.com/biorender-templates.

Similar articles

References

    1. Dobrev D, Aguilar M, Heijman J, Guichard JB, Nattel S. Postoperative atrial fibrillation: mechanisms, manifestations and management. Nat Rev Cardiol 2019;16:417–36. - PubMed
    1. Gaudino M, Di Franco A, Rong LQ, Piccini J, Mack M. Postoperative atrial fibrillation: from mechanisms to treatment. Eur Heart J 2023;44:1020–39. - PMC - PubMed
    1. Weiser TG, Haynes AB, Molina G, Lipsitz SR, Esquivel MM, Uribe-Leitz T, Fu R, Azad T, Chao TE, Berry WR, Gawande AA. Estimate of the global volume of surgery in 2012: an assessment supporting improved health outcomes. Lancet 2015;385:S11. - PubMed
    1. Marcucci M, Devereaux PJ, Devereaux J, Marcucci M, Chan MTV, Smith EE, Absalom AR. Prevention of perioperative stroke in patients undergoing non-cardiac surgery. Lancet Neurol 2023;22:946–58. - PubMed
    1. Zakkar M, Ascione R, James AF, Angelini GD, Suleiman MS. Inflammation, oxidative stress and postoperative atrial fibrillation in cardiac surgery. Pharmacol Ther 2015;154:13–20. - PubMed

LinkOut - more resources