

Real-time monitoring of excess mortality under a new endemic regime
- PMID: 40575909
- PMCID: PMC12207195
- DOI: 10.2807/1560-7917.ES.2025.30.25.2400753
Real-time monitoring of excess mortality under a new endemic regime
Abstract
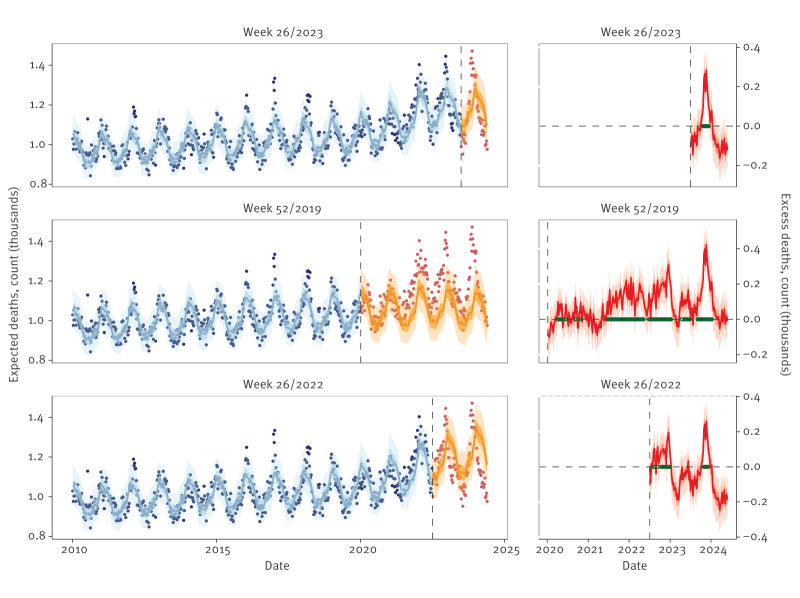
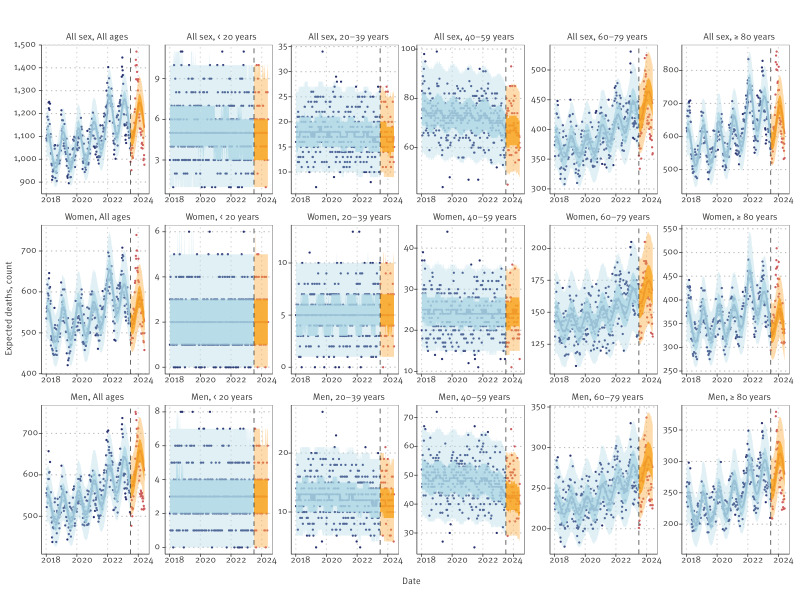
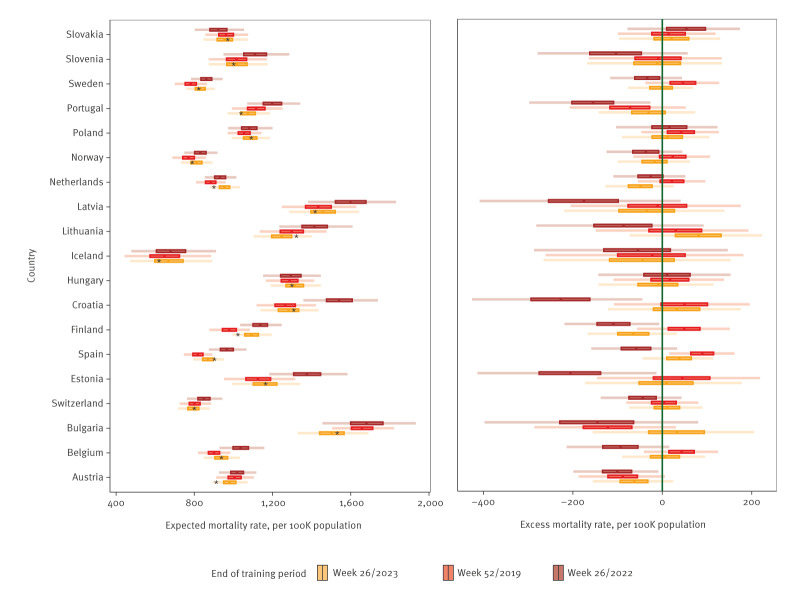
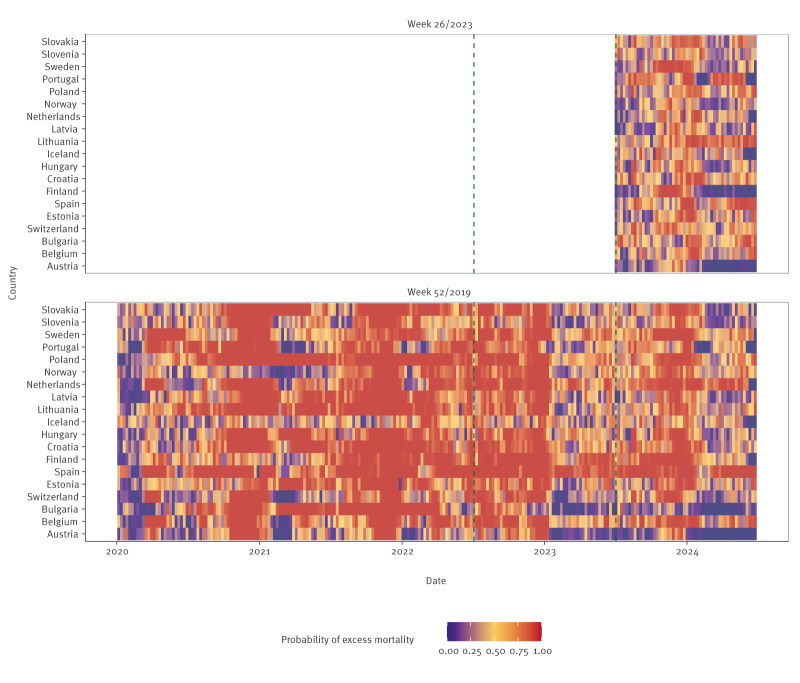
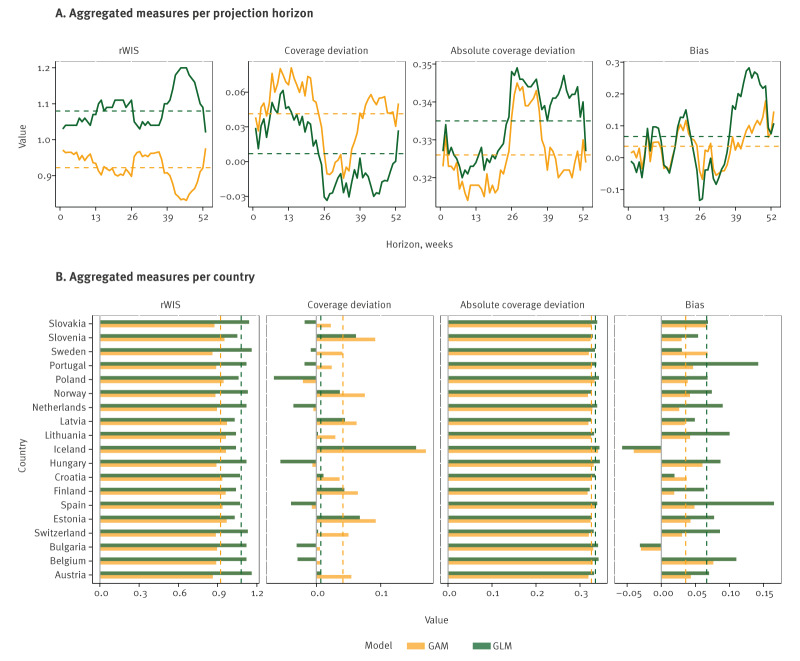
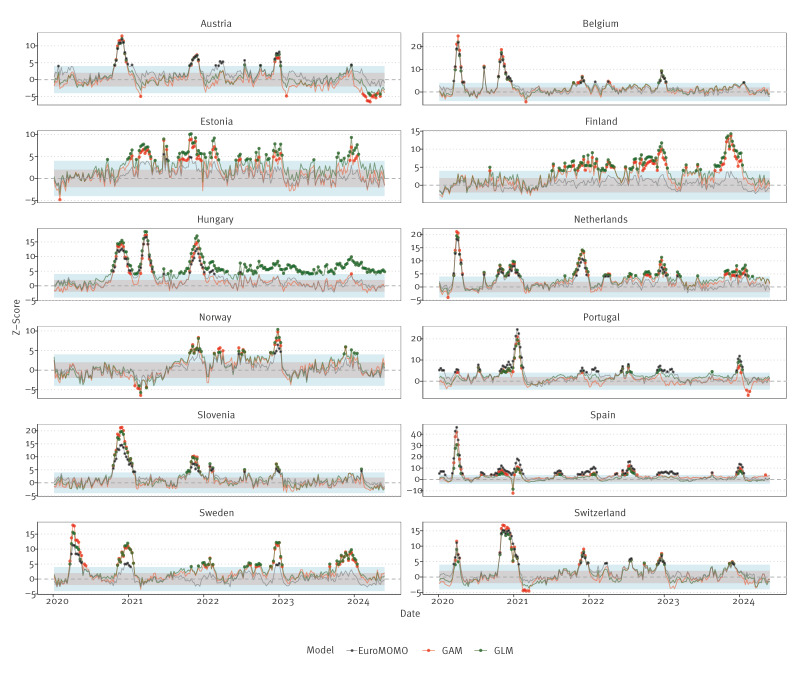
BACKGROUNDMonitoring of mortality to identify trends and detect deviations from normal levels is an essential part of routine surveillance. In many European countries, disruptions in mortality patterns from the COVID-19 pandemic have required revisions to expected mortality estimates (and models) in the current endemic phase of SARS-CoV-2.AIMTo identify essential characteristics for future mortality surveillance and describe two Bayesian methods that satisfy these criteria while being robust to past periods of high COVID-19 mortality. We demonstrate their application in 19 European countries and subnational estimates in the United States, and report measures of model calibration.METHODSWe used a generalised additive model (GAM) with smoothed spline terms for annual trend and within-year seasonality and a generalised linear model (GLM) with a Serfling component for within-year seasonality and breakpoints to detect trend changes in trend. Both approaches modelled change in population size and group-specific (age and sex) mortality patterns.RESULTSModels were well-calibrated and able to estimate national and group-specific mortality before and during the acute COVID-19 pandemic phase. The effect of inclusion of mortality from the acute pandemic period was primarily an increase in uncertainty in expected mortality over the projection period. The GAM approach had better calibration and less variability in bias among countries.CONCLUSIONModels that can adapt to mortality anomalies seen during the acute COVID-19 pandemic period without a need for adjustments to observational data, or tailoring of model specifications, are feasible. The proposed methods can complement operational national and inter-agency surveillance systems currently used in Europe.
Keywords: COVID-19; break points; endemicity; generalised additive models; mortality surveillance.
Conflict of interest statement
Figures
References
-
- National Center for Health Statistics. Excess deaths associated with COVID-19. Atlanta: United States Centers for Disease Control and Prevention; 2023. Available from: https://www.cdc.gov/nchs/nvss/vsrr/covid19/excess_deaths.htm
-
- Office for Health Improvement and Disparities. Excess mortality in England and English regions: March 2020 to December 2023. London: Gov.uk. [Accessed: 12 May 2024]. Available from: https://www.gov.uk/government/statistics/excess-mortality-in-england-and...
MeSH terms
LinkOut - more resources
Full Text Sources
Medical
Miscellaneous