. 2025 Jul;45(7):e70187.
doi: 10.1111/liv.70187.

Amelioration of Liver Fibrosis via In Situ Hepatic Stellate Cell Conversion Through Co-Inhibition of TGF-β and GSK-3 Signalling

Affiliations

Amelioration of Liver Fibrosis via In Situ Hepatic Stellate Cell Conversion Through Co-Inhibition of TGF-β and GSK-3 Signalling

Xiang-Jie Zhu et al. Liver Int. 2025 Jul.

Abstract

Background and aims: Liver fibrosis, a progressive condition driven by chronic liver injury and excessive scar tissue formation, can lead to cirrhosis, a life-threatening disease. Activation of hepatic stellate cells (HSCs) is central to fibrosis progression, yet current therapies fail to halt or reverse this process. This study evaluated a combination therapy targeting HSCs to ameliorate fibrosis and promote liver repair.

Methods: A small molecule cocktail, SBCH (SB431542, a TGF-β inhibitor, and CHIR99021, a GSK-3 inhibitor), was tested in three fibrosis models: CCl4-induced, bile duct ligation (BDL) and non-alcoholic steatohepatitis (NASH) with diethylnitrosamine (DEN). Therapeutic effects were assessed using phenotypic analyses, in vivo tracing and single-cell RNA sequencing to uncover mechanisms.

Results: SBCH significantly reduced fibrosis in all models by inhibiting HSC activation and fibrogenic activity. The suppression of PI3K/Akt pathway and EMT cascade contribute to the fibrosis-ameliorating effect of SBCH treatment. Furthermore, in vivo tracing and single-cell RNA sequencing revealed that SBCH induced the conversion of activated HSCs into hepatocyte-like cells (ciHeps), which integrated into liver tissue, repaired liver damage and restored liver integrity and function.

Conclusions: SBCH mitigates liver fibrosis through multifaceted mechanisms, including the inhibition of HSC activation, suppression of fibrogenic activity and regulation of key signalling pathways such as PI3K/Akt and EMT. In addition, SBCH induces the trans-differentiation of activated HSCs into hepatocyte-like cells (ciHeps), effectively reducing pathogenic HSCs while increasing functional ciHeps. This dual-target approach not only facilitates liver tissue repair but also restores liver function, offering a promising therapeutic strategy for liver fibrosis and cirrhosis, with potential applications in conditions arising from various aetiologies of liver injury.

Keywords: hepatic stellate cells; hepatocytes; lineage tracing; liver fibrosis and cirrhosis; trans‐differentiation.


Conflict of interest statement

The authors declare no conflicts of interest.

Figures
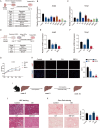
FIGURE 1
FIGURE 1
SBCH combination therapy reduces fibrotic markers in vitro and exhibits antifibrotic effects in a CCl4‐induced liver fibrosis model. (A) Experimental design. Mouse embryonic fibroblasts (MEFs) were isolated from 13.5‐day‐old embryos and treated with various chemicals (SB: 2 μM SB431542; CH: 2 μM CHIR‐99021; BIX: 1.5 μM BIX01294; LDN: 0.5 μM LDN193189; DAPT: 1 μM DAPT; SBCH: SB + CH; SBBIX: SB + BIX; and SCBLD: SB + CH + BIX + LDN + DAPT) for 12 days. (B, C) RT‐qPCR analysis of fibrotic marker gene fibrosis gene: Acta2 (B) and Timp1 (C) in MEFs induced by eight different groups (Control, SB, CH, BIX, LDN, DAPT, SBCH, SBBIX and SCBLD). (D) Experimental design. MFs were obtained by culturing fresh HSCs for 4 days. Followed by treatment with various chemical formulation (Control, SB, CH, SBCH) for 12 days. (E, F) RT‐qPCR analysis of fibrotic marker gene fibrosis gene: Acta2 (E), Timp1 (F) in myofibroblasts (MFs) treated by chemicals (Control, SB, CH, SB + CH). (G) CCK8 analysis was performed for MFs with different chemical cocktails. The treatments include Control, SB, CH, SBCH. (H) Immunofluorescence assay of Ki67 for MFs with different chemical cocktails. The treatments include control, SB, CH, SBCH. Scale bar, 100 μm (I) Experimental design. C57BL/6 mice (n = 6 per group) were subjected to intraperitoneal injections of CCl4 (5 mL/kg body weight as 5% vol/vol in olive oil) thrice a week for 8 weeks. Following this, oral administration of fourdifferent treatments was initiated and continued concurrently with the CCl4 injections until the mice were sacrificed at week 16. The treatment groups included Control: 5% captisol; SB: 2 mg/kg SB431542; CH: 0.75 mg/kg CHIR99021and SBCH:2 mg/kg SB431542 and 0.75 mg/kg CHIR99021. (J) H&E of liver sections from different treatment conditions (Control, SB, CH, SB + CH) in the in vivo experiment. Scale bar, 300 μm. (K) Sirius Red staining and quantification of liver sections from different treatment conditions (Control, SB, CH, SB + CH) in the in vivo experiment. Scale bar, 300 μm. *p < 0.05, **p < 0.01, ***p < 0.001, versus control (one‐way ANOVA analysis). Data are representative of three independent experiments (mean ± SEM) with at least three samples per group.
FIGURE 2
FIGURE 2
SBCH treatment inhibits fibrosis in both fibrosis and cirrhosis models. (A) Fibrosis experiment design. C57BL/6 mice (n = 6 per group) received intraperitoneal injections of CCl4 (5 mL/kg body weight as 5% vol/vol in olive oil) thrice a week for 8 weeks, followed by a 4‐week break. Afterward, they were orally administered either control (5% captisol) or SBCH (2 mg/kg SB431542, 0.75 mg/kg CHIR99021) while continuing CCl4 until sacrifice at Week 20. (B) Sirius Red and αSMA staining of liver tissue in mice with fibrosis, along with quantification results. Scale bar: 300 μm. (C) Collagen production of liver tissue in mice with fibrosis. (D) Cirrhosis experiment design. C57BL/6 mice (n = 6 per group) received intraperitoneal injections of CCl4 (5 mL/kg body weight as 5% vol/vol in olive oil) thrice a week for 12 weeks, followed by an 8‐week break. Next, mice were continued receiving CCl4 till sacrificed. At the 26th week, they were orally administered either control (5% captisol) or SBCH (2 mg/kg SB431542, 0.75 mg/kg CHIR99021) for 12 weeks. (E) Sirius Red and αSMA staining of liver tissue in mice with cirrhosis, along with quantification results. Scale bar: 300 μm. (F) Collagen production of liver tissue in mice with cirrhosis. (G) tSNE clusters of cells from scRNA‐seq. Cells were isolated from the liver of mice in the cirrhosis experiment, using single‐cell RNA sequencing following the Chromium Single Cell 3′ Library system protocol. (H) The percentages of different liver cells isolated from control and SBCH treatment mice across clusters from (G). (I) Expression of hepatic genes in tSNE space. We analysed the expression of hepatic genes, including Alb, Cyp2e1, Ttr and Apoa2, to observe the protein expression related to liver function. (J) Expression of fibrotic genes in tSNE space. We analysed the expression of fibrotic genes, including Lrat, Col1a1, Pdgfrα and Pdgfrβ, to observe changes related to fibrosis. Statistical significance is denoted by *p < 0.05, **p < 0.01, ***p < 0.001 when compared to control, using two‐tailed Student's t‐test. Data are presented as mean ± SEM for six mice in each group.
FIGURE 3
FIGURE 3
SBCH treatment ameliorates fibrosis and improves liver injury in different liver fibrosis mouse models. (A) Schematic illustration of experimental design. HBV‐genetic background mouse model was subjected to intraperitoneal injections of CCl4 (5 mL/kg body weight as 5% vol/vol in olive oil) thrice a week for 8 weeks. Following this, mice (n = 6 per group) were orally administered either control (5% captisol) or SBCH (2 mg/kg SB431542, 0.75 mg/kg CHIR99021), continuing alongside CCl4 injections until sacrificed at week 16. (B) Serum ALT and AST level of control and SBCH‐treated mice within the HBV model. (C) Sirius Red and αSMA staining of liver tissue from control and SBCH‐treated mice in the HBV model, along with corresponding quantification results. Scale bar: 300 μm. (D) RT‐qPCR analysis of fibrotic gene Acta2 and Twist2 in liver tissue from control and SBCH‐treated mice within the HBV model. (E) Schematic illustration of experimental design. Bile duct ligation (BDL) mouse model was treated with control (5% captisol) or SBCH (2 mg/kg SB431542, 0.75 mg/kg CHIR99021) for 3 weeks. Mice were sacrificed on day 30. (F) Serum ALT, AST levels in control and SBCH‐treated mice within the BDL model. (G) Total bilirubin (T‐Bil), direct bilirubin (D‐Bil) levels in control and SBCH‐treated mice within the BDL model. (H) Sirius Red staining and αSMA immunohistochemistry of liver sections from control and SBCH‐treated mice in the BDL model. Scale bars: 300 μm. (I) RT‐qPCR analysis of fibrotic gene Acta2 and Twist2 in liver tissue from control and treated mice within the BDL model. (J) Schematic illustration of experimental design. Rats (n = 6 per group) received an injection of diethylnitrosamine (DEN) at a dose of 25 mg/kg at 2 weeks of age. Starting at 4 weeks, they were fed a high‐fat diet. At 8 weeks, they were orally administered either control (5% captisol) or SBCH (2 mg/kg SB431542, 0.75 mg/kg CHIR99021) for 8 weeks. The rats were then sacrificed at week 16 for further analysis. (K) Serum ALT and AST level of control and SBCH‐treated rats within the NASH model. (L) Sirius Red and αSMA staining of liver tissue from control and SBCH‐treated rats in the NASH model. Scale bars: 300 μm. (M) RT‐qPCR analysis of fibrotic gene Acta2 and Twist2 in liver tissue from control and treated rats within the NASH model. Statistical significance is denoted by *p < 0.05, **p < 0.01, ***p < 0.001 when compared to control, using two‐tailed Student's t‐test. Data are presented as mean ± SEM for six mice in each group.
FIGURE 4
FIGURE 4
SBCH treatment suppressed the fibrosis‐related gene expressions in MFs and PI3K/AKT and EMT signalling involved in this cascade. (A) Experimental design. MFs isolated from C57BL/6 or BALB/c mice were treated with SBCH, followed by RNA‐seq analysis. (B) Heatmap displaying RNA‐seq data. Cells treated with either control (DMSO) or SBCH (2 μM SB431542, 2 μM CHIR99021) for 12 days. All samples were harvested on day 12. ‘CMF1’ and ‘CMF2’ refer to control MFs isolated from C57BL/6 mice and activated in vitro, whereas ‘BMF1’ and ‘BMF2’ refer to control MFs isolated from BALB/c mice. ‘CMF‐SBCH1’ and ‘CMF‐SBCH2’ denote SBCH‐treated MFs from C57BL/6 mice, and ‘BMF‐SBCH1’ and ‘BMF‐SBCH2’ denote SBCH‐treated MFs from BALB/c mice. (C) RT‐qPCR analysis of Mmp3 and Acta2 in cells treated with different chemical cocktails. The treatments include control, SB, CH, SBCH. (D) KEGG (Kyoto Encyclopedia of Genes and Genomes) enrichment analysis of RNA‐seq data in control and SBCH treatment groups. (E) Western blotting analysis was performed for MFs with different chemical cocktails. The treatments include control, SB, CH, SBCH. (F) Quantification from (E). (G) GO (Gene Ontology) enrichment analysis of RNA‐seq data in control and treatment groups. (H) Western blotting analysis was performed for MFs with different chemical cocktails. The treatments include control, SB, CH, SBCH. (I) Quantification from (H). Control: DMSO; SB: 2 μM SB431542; CH: 2 μM CHIR99021; SBCH: 2 μM SB431542, 2 μM CHIR99021. Statistical significance is denoted by *p < 0.05, **p < 0.01, ***p < 0.001 when compared to control, using two‐tailed Student's t‐test. Data are presented as mean ± SEM for at least three samples in each group, compiled from three independent experiments.
FIGURE 5
FIGURE 5
SBCH suppresses myofibroblast (MF) activation via AKT/Snail‐dependent inhibition. (A) AKT pathway analysis in MFs transfected with AKT‐ or/and Snail‐targeting siRNA. (B) Quantification from (A). (C) EMT marker expression following AKT or/and Snail siRNA transfection. (D) Quantification of (C). (E) AKT pathway activation in MFs overexpressing AKT/Snail and treated with SBCH. (F) Quantification from (E). (G) EMT marker expression in AKT/Snail‐overexpressing MFs and treated with SBCH. (H) Quantification from (G). Statistical significance is denoted by *p < 0.05, **p < 0.01, ***p < 0.001 when compared to control, using one‐way ANOVA analysis (A–D) and two‐tailed Student's t‐test (E–H). Data are presented as mean ± SEM for at least three samples in each group, compiled from three independent experiments.
FIGURE 6
FIGURE 6
SBCH treatment ameliorates fibrosis in the mTmG/Alb‐Cre lineage‐tracing liver fibrosis mouse models through inducing part of non‐hepatocytes into hepatocytes. (A) Schematic diagram of the mTmG/Alb‐Cre model. (B) Experimental design. mTmG/Alb‐Cre mice (n = 6 per group) received intraperitoneal injections of CCl4 (5 mL/kg body weight as 5% vol/vol in olive oil) thrice a week for 8 weeks, followed by a 4‐week break. Then, mice were then treated with either 5% captisol (control) or SBCH (2 mg/kg SB431542 and 0.75 mg/kg CHIR99021) for 8 weeks. (C) αSMA immunofluorescent staining on cryosections of mTmG/Alb‐Cre mouse livers. (D) ALB immunofluorescent staining on cryosections of mTmG/Alb‐Cre mouse livers. (E) Representative FACS sorting result of EFGP+ hepatocytes (endogenous hepatocytes, eHeps) and tdTomato+ hepatocytes (MF‐derived hepatocyte cells, ciHeps). Hepatocytes were isolated from mTmG/ALB‐Cre mice treated with SBCH. The percentage of EGFP+ Hepatocytes (eHeps) achieved 67.9%, while tdTomato+ Hepatocytes (ciHeps) achieved 18.8%. (F) ALB immunofluorescent staining in ciHeps (tdTomato+ cells) and eHeps (EGFP+ cells). (G) PAS staining and oil‐red staining in ciHeps and eHeps. (H–I) Productions of ALB (H) and urea (I) in culture ciHeps and eHeps in vitro. Cells were collected by FACS sorting and cultured for 24 h before being analysed using an ELISA kit for ALB production and a measuring kit for Urea production. (J) Heatmap of RNA‐seq analysis among eHeps, ciHeps and MFs (n = 2). MFs as control. (K) RNA‐seq heatmap of comparison of MF, eHep and ciHep with fibrosis gene expressions (n = 2). (L) RNA‐seq heatmap of comparison of MF, eHep and ciHep with hepatocyte gene expressions (n = 2). Statistical significance is denoted by *p < 0.05, **p < 0.01, ***p < 0.001 when compared to control, using two‐tailed Student's t‐test. NS, non‐significant, n = 6. Scale bars, 100 μm.
FIGURE 7
FIGURE 7
SBCH treatment ameliorates liver cirrhosis in the mTmG/Pdgfrβ‐Cre cirrhotic mouse models by trans‐differentiating activated HSCs into hepatocytes. (A) Schematic diagram of the mTmG/Pdgfrβ‐Cre model. (B) Experimental design. mTmG/Pdgfrβ‐Cre mice (n = 6 per group) received intraperitoneal injections of CCl4 (5 mL/kg body weight as 5% vol/vol in olive oil) thrice a week for 12 weeks, followed by an 8‐week break. CCl4 injections were resumed for an additional 6 weeks. Mice were then treated with either 5% captisol (control) or SBCH (2 mg/kg SB431542 and 0.75 mg/kg CHIR99021) for 12 weeks, with CCl4 injections continuing until the mice were sacrificed. (C) Immunofluorescent staining results of αSMA. Immunofluorescent staining of αSMA was conducted on frozen tissue slides using a 1:1000 dilution, followed by imaging with confocal microscopy. (D) Immunofluorescent staining results of HNF4α. Immunofluorescent staining of HNF4α was performed on frozen tissue slides using a 1:1000 dilution, followed by imaging with confocal microscopy. (E) Representative FACS analysis results for hepatocytes isolated from control and SBCH‐treated mice (n = 3). (F) Immunofluorescent staining results of ALB. Immunofluorescent staining of ALB was carried out on isolated hepatocytes obtained from the livers of both control and treated mice. (G) Identification of GFP expression in hepatocytes and HSCs in both the control and SBCH treatment groups (n = 3).

Similar articles

References

    1. Moon A. M., Singal A. G., and Tapper E. B., “Contemporary Epidemiology of Chronic Liver Disease and Cirrhosis,” Clinical Gastroenterology and Hepatology 18 (2020): 2650–2666. - PMC - PubMed
    1. Xiao J., Wang F., Wong N.‐K., et al., “Global Liver Disease Burdens and Research Trends: Analysis From a Chinese Perspective,” Journal of Hepatology 71 (2019): 212–221. - PubMed
    1. Tsuchida T. and Friedman S. L., “Mechanisms of Hepatic Stellate Cell Activation,” Nature Reviews Gastroenterology & Hepatology 14 (2017): 397–411. - PubMed
    1. Younossi Z. M., Wong G., Anstee Q. M., and Henry L., “The Global Burden of Liver Disease,” Clinical Gastroenterology and Hepatology 21 (2023): 1978–1991. - PubMed
    1. Sung H., Ferlay J., Siegel R. L., et al., “Global Cancer Statistics 2020: GLOBOCAN Estimates of Incidence and Mortality Worldwide for 36 Cancers in 185 Countries,” CA: A Cancer Journal for Clinicians 71 (2021): 209–249. - PubMed

MeSH terms