. 2025 Jun;29(12):e70674.
doi: 10.1111/jcmm.70674.

Hippo Pathway Regulates Cell Proliferation in Skin Epidermis Exposed to Mechanical Forces

Affiliations

Hippo Pathway Regulates Cell Proliferation in Skin Epidermis Exposed to Mechanical Forces

Joanna K Ledwon et al. J Cell Mol Med. 2025 Jun.

Abstract

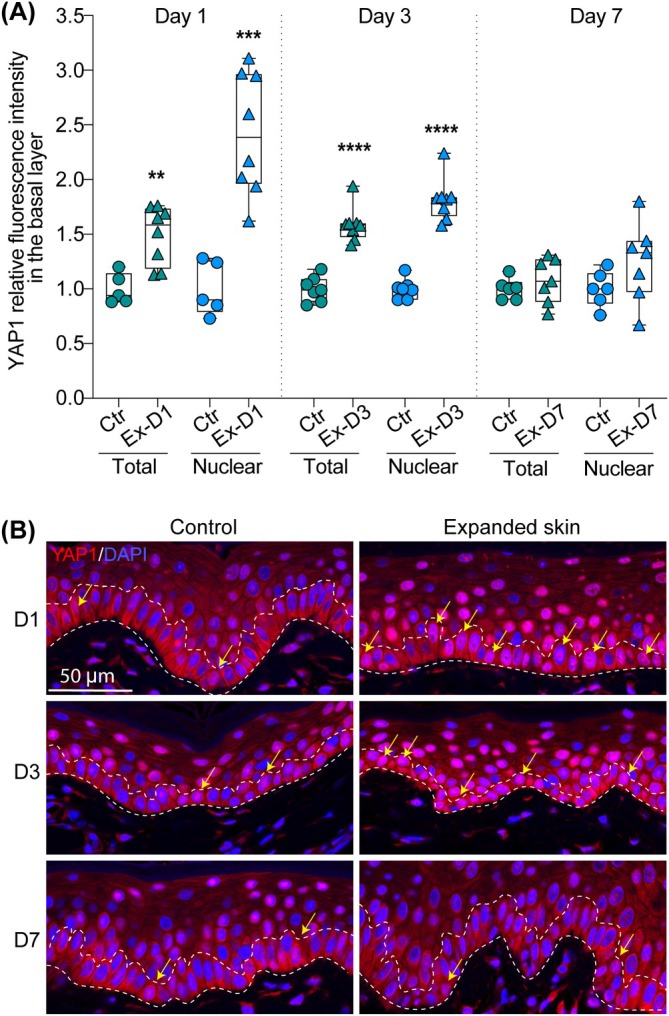
Tissue expansion is an integral component of reconstructive surgery used to promote native skin growth. This process is driven by the gradual inflation of the tissue expander placed subcutaneously on the patient's body. Despite its widespread use, the lack of in vivo evidence on the biological processes underlying skin growth has limited technological advancements. Here, we explore the gene and protein expression changes that control mechanically induced skin growth during tissue expansion. Using a porcine tissue expansion model, we revealed that skin expansion disrupts key components responsible for epithelial integrity, as evidenced by the loss of E-cadherin and alpha-catenin expression in expanded skin compared to the unexpanded control. This disruption correlates with the translocation of the transcriptional factor YAP1 from the membrane to the nucleus, activating keratinocyte proliferation and possibly regulating other critical processes involved in skin adaptation to mechanical stretch. Our data show that in vivo cell proliferation is mediated by force-induced changes in the composition of molecular complexes formed by E-cadherin, alpha-catenin, and YAP1.

Keywords: cell proliferation; epidermis; hippo pathway; mechanical forces; mechanotransduction; skin growth; tissue expansion.


Conflict of interest statement

The authors declare no conflicts of interest.

Figures

FIGURE 1
FIGURE 1
Changes in CDH1 expression in skin samples during tissue expansion. (A) Relative expression of CDH1 expression assessed by qRT‐PCR in control (Ctr) and expanded skin (Ex) collected at day 1 (D1), day 3 (D3) and day 7 (D7) of expansion compared to corresponding unexpanded control. The values were normalised to the geometric mean calculated for two reference genes: RLPL0 and B2M. Data on graphs present results for one of two tested biological repeats. Each dot represents results for one biopsy (n ≥ 5). (B) Quantitative analysis and (C) representative images (40× magnification) of IF staining of E‐cadherin expression in control (Ctr) and expanded skin (Ex) at day 1 (D1), day 3 (D3) and day 7 (D7) of expansion. In (B), each dot represents results for one picture. In (A) and (B), the line in the middle of the box is plotted at the median and the whiskers represent minimum and maximum values. Values represent fold changes between controls and tested samples, and the average value for each control was set as 1. In (C), dashed lines mark the basal layer of the epidermis. (C′) presents the magnified views of the area marked in panel C. Statistical significance calculated with unpaired Student t‐test is shown as **p ≤ 0.01, ***p ≤ 0.001, ****p ≤ 0.0001.
FIGURE 2
FIGURE 2
Changes in alpha‐catenin expression in skin samples during tissue expansion. (A) Quantitative analysis and (B‐D) representative images (40× magnification) of IF staining of alpha‐catenin expression in control (Ctr) and expanded skin (Ex) at day 1 (D1), day 3 (D3) and day 7 (D7) of expansion. In (A), each dot represents results for one picture. The line in the middle of the box is plotted at the median and the whiskers represent minimum and maximum values. Values represent fold changes between controls and tested samples, and the average value for each control was set as 1. Statistical significance calculated with unpaired Student t‐test is shown as **p ≤ 0.01. In (B‐D), dashed lines mark the basal layer of the epidermis and right panel presents the magnified views of the area marked in left panel.
FIGURE 3
FIGURE 3
Quantification of YAP1 activation and subcellular localisation in the basal layer of the epidermis in response to mechanical stretching. (A) Quantitative analysis of YAP1 fluorescence intensity in the basal layer of the epidermis (total) and in the nuclei (nuclear) in control (Ctr) and expanded skin (Ex) at day 1 (D1), day 3 (D3) and day 7 (D7) of expansion. Each dot represents results for one picture. The line in the middle of the box is plotted at the median and the whiskers represent minimum and maximum values. Values represent fold changes between controls and tested samples, and the average value for each control was set as 1. Statistical significance calculated with unpaired Student t‐test is shown as **p ≤ 0.01, ***p ≤ 0.001, ****p ≤ 0.0001. (B) Representative images (40× magnification) of IF staining of YAP1 in control and expanded skin at day 1 (D1), day 3 (D3) and day 7 (D7) of expansion. Dashed lines mark the basal layer of the epidermis. The yellow arrows indicate cells with YAP1 nuclear localisation.
FIGURE 4
FIGURE 4
Correlation analysis between YAP1 activation and basal keratinocyte proliferation. (A) Quantitative analysis of the number of cell expressing YAP1 and Ki‐67 in the basal layer of the epidermis based on double IF staining in control (Ctr) and expanded skin (Ex) at day 1 (D1) and day 7 (D7) of expansion. Each dot represents results for one section. At least three images were analysed for each section. The line in the middle of the box is plotted at the median and the whiskers represent minimum and maximum values. Statistical significance calculated with unpaired Student t‐test is shown as ****p ≤ 0.0001. (B) Representative images (40× magnification) of double IF staining of YAP1 and Ki‐67 in control (Ctr) and expanded skin (Ex) at day 1 (D1) and day 7 (D7) of expansion. Dashed lines mark the epidermal‐dermal junction. The green arrows indicate Ki‐67+ cells, and yellow arrows indicate double positive YAP1+ Ki‐67+ cells. (C) Quantitative analysis of Ki‐67+ cells expressing YAP1, and YAP1+ cells expressing Ki‐67 in control (Ctr) and expanded skin (Ex) at day 1 (D1) and day 7 (D7) of expansion. Error bars represent SD. Statistical significance calculated with unpaired Student t‐test is shown as ****p ≤ 0.0001.

References

    1. Neumann C. G., “The Expansion of an Area of Skin by Progressive Distention of a Subcutaneous Balloon; Use of the Method for Securing Skin for Subtotal Reconstruction of the Ear,” Plastic and Reconstructive Surgery 19, no. 2 (1957): 124–130, 10.1097/00006534-195702000-00004. - DOI - PubMed
    1. LoGiudice J. and Gosain A. K., “Pediatric Tissue Expansion: Indications and Complications,” Journal of Craniofacial Surgery 14, no. 6 (2003): 866–872, 10.1097/00001665-200311000-00008. - DOI - PubMed
    1. Gosain A. K., Turin S. Y., Chim H., and LoGiudice J. A., “Salvaging the Unavoidable: A Review of Complications in Pediatric Tissue Expansion,” Plastic and Reconstructive Surgery 142, no. 3 (2018): 759–768, 10.1097/PRS.0000000000004650. - DOI - PubMed
    1. Wooten K. E., Ozturk C. N., Ozturk C., Laub P., Aronoff N., and Gurunluoglu R., “Role of Tissue Expansion in Abdominal Wall Reconstruction: A Systematic Evidence‐Based Review,” Journal of Plastic, Reconstructive & Aesthetic Surgery 70, no. 6 (2017): 741–751, 10.1016/j.bjps.2017.02.018. - DOI - PubMed
    1. Zollner A. M., Holland M. A., Honda K. S., Gosain A. K., and Kuhl E., “Growth on Demand: Reviewing the Mechanobiology of Stretched Skin,” Journal of the Mechanical Behavior of Biomedical Materials 28 (2013): 495–509, 10.1016/j.jmbbm.2013.03.018. - DOI - PMC - PubMed

MeSH terms

LinkOut - more resources