. 2025 Jul 15;138(14):jcs263808.
doi: 10.1242/jcs.263808. Epub 2025 Jul 18.

14-3-3ε inhibits premature centriole disengagement by inhibiting the activity of Plk1 and separase

Affiliations

14-3-3ε inhibits premature centriole disengagement by inhibiting the activity of Plk1 and separase

Monika A Jaiswal et al. J Cell Sci. .

Abstract

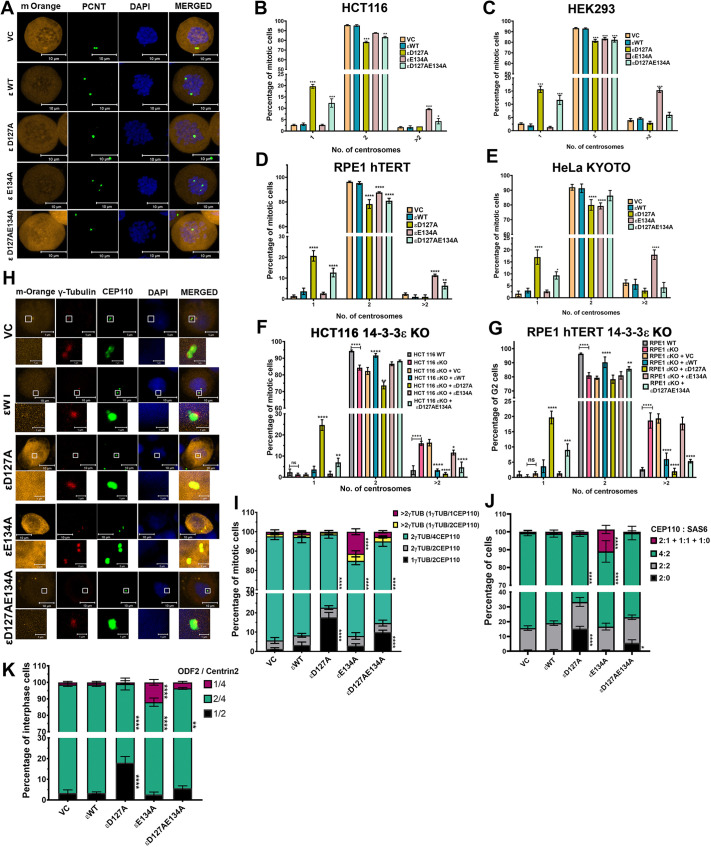
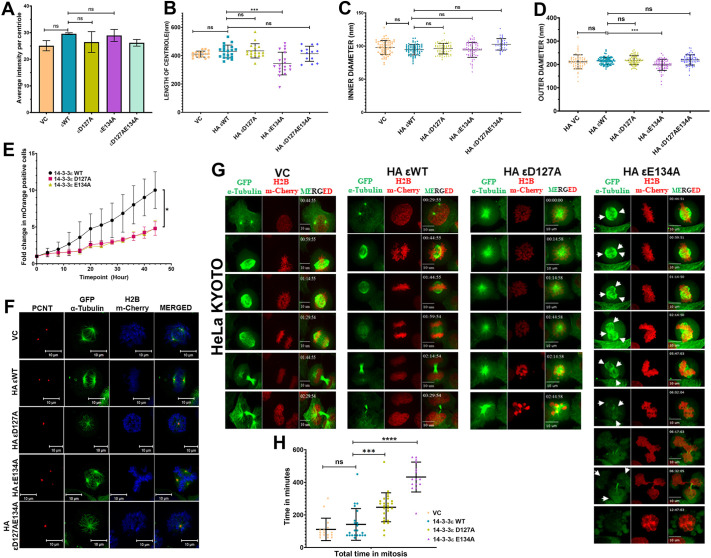
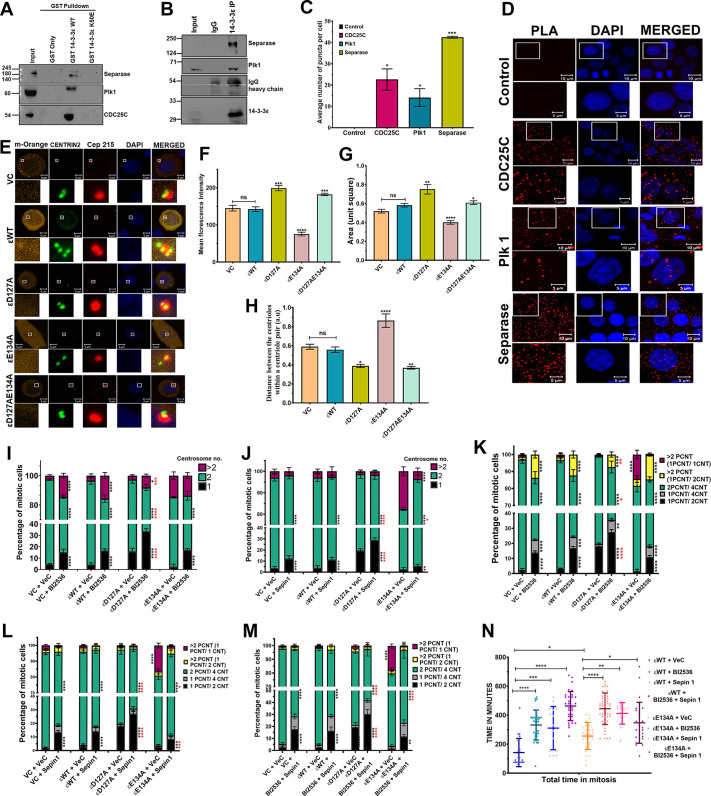
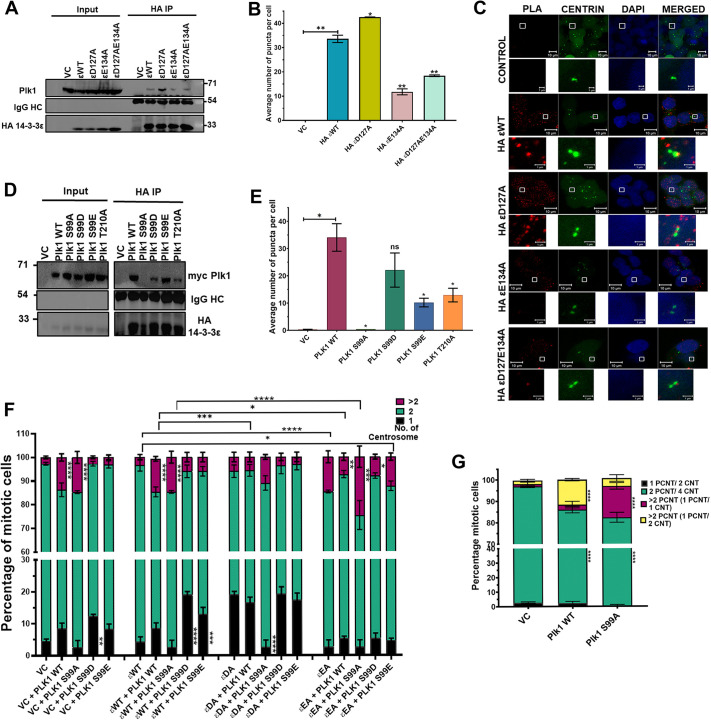
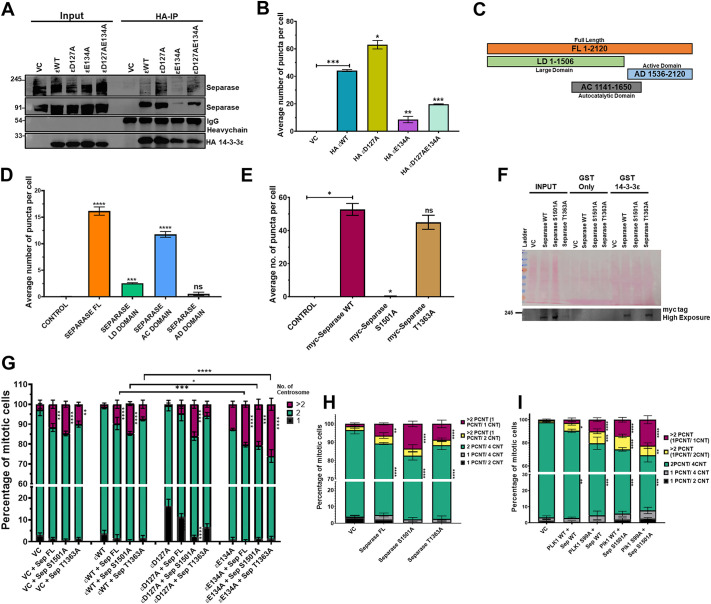
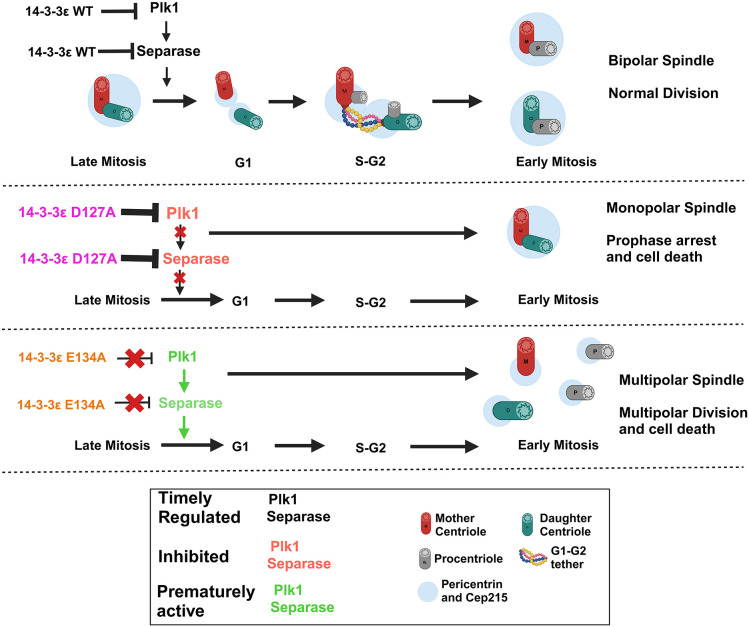
The 14-3-3 protein family regulates several pathways in mammalian cells, including centrosome duplication. However, the precise mechanisms by which 14-3-3 paralogs regulate the centrosome cycle remain unclear. To identify the mechanisms by which 14-3-3ε regulates centrosome duplication, we altered two conserved acidic residues in the 14-3-3ε phospho-peptide-binding pocket that regulate complex formation and dissociation with the associated ligands, D127 and E134, to alanine. Altering these residues to alanine led to opposing effects on centrosome duplication; the D127A mutant inhibited centrosome duplication, whereas cells expressing the E134A mutant showed the presence of supernumerary centrosomes. We demonstrate that 14-3-3ε does not inhibit centriole duplication, as reported for 14-3-3γ, but inhibits centriole disengagement. Using a combination of pharmacological and genetic approaches, we demonstrate that 14-3-3ε inhibits the activity of Plk1 and separase [also known as separin (ESPL1)], leading to disengagement defects that ultimately lead to decreased proliferation and cell death. Our work demonstrates that different 14-3-3 paralogs regulate different steps in the centrosome cycle and that disrupting complex formation between 14-3-3ε and Plk1 or separase could be a novel therapeutic strategy in tumor cells.

Keywords: 14-3-3ε; Centriole disengagement; Centrosome cycle; Plk1; Separase.


Conflict of interest statement

Competing interests The authors declare no competing or financial interests.

Figures

Fig. 1.
Fig. 1.
14-3-3ε mutants alter centrosome numbers in different cell lines. (A,B) HCT116 cells were transfected with the mOrange vector control (VC), and mOrange-tagged wild-type (WT) and mutant (D127A, E134A, D127AE134A) 14-3-3ε constructs. The cells were arrested in mitosis with nocodazole, stained with antibodies to percentrin (green) and counterstained with DAPI (blue). The number of mitotic cells showing 1, 2 or >2 centrosomes was determined in three independent experiments. Representative images are shown (A), and the mean±s.d. of three independent experiments are plotted (B). (C–G) The number of cells transfected with the indicated 14-3-3ε constructs showing 1, 2 or >2 centrosomes were determined in HEK293 (C), RPE1-hTERT (D), HELA KYOTO (E), HCT11614-3-3εKO (F) and RPE1 hTERT14-3-3εKO (G) cells. Three cell lines were arrested in prophase (C,E,F), whereas the RPE1hTERT cell lines (D,G) were arrested in G2 via use of a Cdk1 inhibitor. The mean±s.d. from three independent experiments is plotted. (H,I) HCT116 cells expressing the indicated 14-3-3ε constructs (orange) were fixed and stained with antibodies to γ-tubulin (red) and CEP110, (green) and counterstained with DAPI (blue). Representative images are shown (H). The γ-tubulin-to-CEP110 ratio was determined in three independent experiments, and the mean±s.d. are plotted (I). (J) HCT116 cells stably transfected with the VC and indicated HA14-3-3ε constructs were stained with antibodies to SAS6 and CEP110 and counterstained with DAPI. The CEP110-to-SAS6 ratio was determined in three independent experiments, and the mean±s.d. of three independent experiments were plotted. (K) HCT116 cells co-transfected with GFP–Centrin2 and the indicated 14-3-3ε constructs were stained with antibodies to ODF2 and counterstained with DAPI. The ODF2-to-Centrin2 ratio was determined in three independent experiments. *P<0.05; **P<0.01; ***P<0.001; ****P<0.0001; ns, not significant (two-way ANOVA with Tukey's multiple comparison). All comparisons are to cells transfected with the WT construct. Ratios refer to number of spots for each signal. ε, 14-3-3ε. Scale bars: 10 μm (A, H, main images other than VC); 5 μm (H, main images VC); 1 μm (H, magnifications).
Fig. 2.
Fig. 2.
14-3-3ε prevents centriole disengagement. (A) Cartoon depicting the potential defect in centrosome duplication in cells expressing 14-3-3ε mutant constructs. (B–D) HCT116 and HEK293 cells were co-transfected with GFP–Centrin2 (green) and the mOrange-tagged 14-3-3ε constructs (orange), arrested in mitosis with nocodazole, and fixed and stained with antibodies to pericentrin (red) and counterstained with DAPI (blue). Representative images for HCT116 cells are shown (B). The pericentrin-to-centrin (PCNT/CNT) ratio was determined in three independent experiments for HCT116 cells (C) and HEK293 cells (D). Mean±s.d. is plotted. (E) Cartoon depicting the components and localization of the G1-G2 tether. (F,G) HCT116 cells transfected with the indicated constructs were arrested in G2 with a Cdk1 inhibitor, stained with antibodies to the G1-G2 tether protein rootletin and counterstained with DAPI. Representative images are shown (F), and the rootletin-to-centrin ratio was determined in three independent experiments, and the mean±s.d. plotted (G). (H) HCT116 cells were transfected with the indicated constructs, arrested in G2, and stained with antibodies to Cep68 and counterstained with DAPI. The Cep68-to-Centrin2 ratio was determined in three independent experiments, and the mean±s.d. plotted. (I,J) HCT116 cells were transfected with the indicated constructs, arrested in G2 and stained with antibodies to ODF2. Representative images are shown (I), and the mean±s.d. of three independent experiments plotted (J). *P<0.05; ***P<0.001; ****P<0.0001; ns, not significant (two-way ANOVA with Tukey's multiple comparison). All comparisons are to cells transfected with the WT construct. Ratios refer to number of spots for each signal. ε, 14-3-3ε. Scale bars: 10 μm (B,C, main images); 1 μm (B,C, magnifications); 5 μm (I, main images), 0.5 μm (I, magnifications).
Fig. 3.
Fig. 3.
Expression of the 14-3-3ε mutants leads to a mitotic delay and cell death. (A) HCT116 cells transfected with the indicated constructs were arrested in mitosis and stained with antibodies to glutamylated tubulin (GT335), and the signal intensity was measured. The mean±s.d. from three independent experiments are plotted. (B–D) HCT116 cells stably expressing the vector control (VC) and HA-tagged 14-3-3ε constructs were synchronized in G2-M phase and processed for transmission electron microscopy. The length of the centriole (n>15) (B), the inner diameter of the centriole (n>39) (C), and the outer diameter of the centriole (n>69) (D) were measured in three independent experiments and the mean±s.d. plotted. (E) The proliferation of HCT116 cells expressing the vector control and mOrange-tagged 14-3-3ε constructs was measured in an Incucyte live cell analysis system. Images of the same field were acquired every hour, and the mean±s.d. of the normalized counts (mOrange positive/total number of cells) per field from three independent experiments were plotted against time (hours). (F) HeLa KYOTO cells stably transfected with the vector control and HA-tagged 14-3-3ε constructs were arrested in mitosis and stained with antibodies against pericentrin (red). The cells express GFP α-tubulin (green) and H2B–mCherry (blue). (G,H) HeLa KYOTO cells stably expressing the vector control and HA-tagged 14-3-3ε constructs were imaged over 24 h in an Olympus 3i spinning disc microscope. Representative images of the same cell acquired over the period and stained for GFP–α-tubulin (green) and H2B–mCherry (red) are shown with the time stamp in the upper left corner. The arrowheads indicate microtubule-organizing centers, showing the premature disengagement of centrioles (G). The mean±s.d. of the time spent in mitosis of ≥15 cells across three independent experiments is plotted (H). Note that in contrast to the VC or WT-expressing cells, the D127A cells never complete mitosis, and the E134A cells undergo multipolar mitosis. *P<0.05; ***P<0.001; ****P<0.0001; ns, not significant [Student's unpaired t-test with Welch's correction (A); one-way ANOVA with Tukey's multiple comparison (B–E,H)]. All comparisons are to cells transfected with the WT construct. ε, 14-3-3ε. Scale bars: 10 μm.
Fig. 4.
Fig. 4.
14-3-3ε forms a complex with Plk1 and separase. (A) Protein extracts prepared from HCT116 cells were incubated with the indicated GST fusion proteins, and the reactions resolved on SDS-PAGE gels, followed by western blotting with the indicated antibodies. Input, 10%. (B) Protein extracts prepared from HCT116 cells were incubated with either a non-specific IgG or antibodies to 14-3-3ε, and the reactions resolved on SDS-PAGE gels followed by western blotting with the indicated antibodies. Input, 10%. Blots shown representative of three repeats. (C,D) PLAs were performed in HCT116 cells, using antibodies against 14-3-3ε and either Plk1, separase and cdc25C. Representative images are shown (D), and the mean±s.d. of the number of puncta per cell from three independent experiments are plotted (C). (E–H) HCT116 cells overexpressing GFP–Centrin2 and mOrange or mOrange-tagged 14-3-3ε constructs were arrested in mitosis and stained with antibodies to Cep215 and counter stained with DAPI. Representative images are shown (E), and the mean±s.e.m. from three independent experiments for the intensity of Cep215 staining (F), centrosome size (G) and distance between the centriole pair (H) pair is plotted. (I,J) Cell lines were transfected with mOrange vector control or mOrange-tagged 14-3-3ε constructs and were treated with BI2536 and/or Sepin1 or the vehicle control (DMSO). The mean±s.d. of the number of centrosomes in mitotic cells from three independent experiments are plotted for cells treated with BI2536 (I) or Sepin-1 (J). (K–M) HCT 116 cells were transfected with the mOrange vector control (VC) or mOrange-tagged 14-3-3ε constructs and GFP–Centrin2, and were treated with BI2536, Sepin-1, both BI2356 and Sepin-1, or the vehicle control (DMSO). The mean±s.d. of the pericentrin to centrin2 ratio from three independent experiments is plotted for BI2536 (K), Sepin-1 (L) and BI2536 and Sepin1 (M). (N) HeLa KYOTO cells stably expressing HA-tagged 14-3-3ε WT or 14-3-3ε E134A were treated with vehicle control (DMSO), BI2536, Sepin-1 or both BI2536 and Sepin-1, and were imaged for 20 h at intervals of 20 min. The mean±s.d. from ≥15 cells across three independent experiments are plotted. *P<0.05, **P<0.01, ***P<0.001; ****P<0.0001; ns, not significant [unpaired Student's t-test with Welch's correction (C, F–H); one-way ANOVA Tukey's multiple comparison (I–N; black asterisks refer to comparison within the group with respective vehicle control, red asterisks refer to comparison across the group with 14-3-3ε WT treated with drug)]. Ratios refer to number of spots for each signal. ε, 14-3-3ε. Scale bars: 10 μm (D, main images); 5 μm (D, magnifications, E).
Fig. 5.
Fig. 5.
14-3-3ε inhibits Plk1, preventing centriole disengagement. (A) Protein extracts prepared from HCT116 cells transfected with vector control or HA-tagged 14-3-3ε constructs were incubated with antibodies against HA, and the reactions resolved on SDS-PAGE gels followed by western blotting with the indicated antibodies. Input, 10%. Blot shown representative of three repeats. (B,C) HCT116 cells stably expressing GFP–Centrin2 were transfected with the indicated constructs and PLA assays performed using antibodies against HA and Plk1. Representative images are shown in C. PLA, red; DAPI, blue. The mean±s.d. number of puncta per cell for three independent experiments is plotted (B). (D,E) HCT116 cells expressing HA-tagged 14-3-3ε WT were co-transfected with GFP–Centrin2 and Myc-tagged WT Plk1 mutant constructs (S99A, S99D, S99E and T210A). Protein extracts were prepared from these cells, and immunoprecipitations were performed with antibodies to HA, followed by western blotting with the indicated antibodies. Blot shown representative of three repeats (D). PLAs using antibodies against the HA and Myc epitopes were performed, and the mean and standard deviation of the number of puncta per cell for three independent experiments were plotted (E). (F) HCT116 cells stably expressing vector control and HA-tagged 14-3-3ε constructs were transfected with Myc-tagged Plk1 WT and mutant constructs (S99A,S99D and S99E) followed by staining with antibodies against the Myc epitope tag and pericentrin. The centrosome number in mitotic cells was determined in three independent experiments, and the mean±s.d.were plotted. (G) HCT116 cells stably expressing the vector control, Myc-tagged Plk1 WT and the Plk1 S99A mutant were stained with antibodies to the Myc epitope tag, Centrin2 and pericentrin and the PCNT/CNT ratio was determined in three independent experiments, and the mean±s.d. plotted. *P<0.05; **P<0.01; ***P<0.001; ****P<0.0001 [unpaired Student's t-test with Welch's correction (B,E); two-way ANOVA with Tukey's multiple comparison (G)]. Ratios refer to number of spots for each signal. ε, 14-3-3ε. Scale bars: 10 μm (main images); 1 μm (magnifications).
Fig. 6.
Fig. 6.
14-3-3ε inhibits separase function, inhibiting centriole disengagement. (A) Protein extracts prepared from HCT116 cells transfected with the indicated constructs were incubated with antibodies to HA, and the reactions resolved on SDS-PAGE gels followed by western blotting with the indicated antibodies. Blot shown representative of three repeats. (B) HCT116 cells stably expressing GFP–Centrin2 were transfected with the indicated constructs and PLA assays performed using antibodies against HA and separase. The number of PLA puncta per cell was determined in three independent experiments, and the mean±s.d. plotted. (C) Diagram of the separase deletion mutants. (D) Protein extracts were prepared from HCT116 cells transfected with Myc-tagged separase (FL) and Myc-tagged deletion mutants [large domain (LD), auto-catalytic domain (AC), and active domain (AD)]. PLA assays were performed with antibodies to Myc and 14-3-3ε, and the number of PLA puncta per cell was determined in three independent experiments, and the mean±s.d. plotted. (E) HCT116 cells stably expressing GFP–Centrin2 were transfected with Myc-tagged separase WT and mutant constructs (S1501A and T1363A), and PLA assays were performed with antibodies to the Myc epitope tag and 14-3-3ε. The number of PLA puncta per cell was determined in three independent experiments, and the mean±s.d. plotted. (F) Protein extracts prepared from HCT116 cells were transfected with Myc-tagged separase WT mutant constructs (S1501A and T1363A) were incubated with the indicated GST fusion proteins followed by western blotting with the indicated antibodies. Input. 10%. Blot shown representative of three repeats (G) HCT116 cells stably expressing vector control and HA-tagged 14-3-3ε constructs were transfected with Myc-tagged separase WT, and Myc-tagged separase (S1501A andT1363A) constructs, the cells arrested in mitosis followed by staining with antibodies to Myc and pericentrin. The mean±s.d. of the centrosome number for three independent experiments is plotted. (H) HCT116 cells stably expressing GFP–Centrin2 were transfected with Myc-tagged separase WT and mutant constructs (S1501A and T1363A) and stained with antibodies against the Myc epitope tag, pericentrin and the PCNT/CNT ratio was determined was determined in three independent experiments. The mean±s.d. is plotted. (I) HCT116 cells stably expressing Myc-tagged Plk1 and Myc-tagged Plk1 S99A were transfected with Myc-tagged separase, and Myc-tagged separase S1501A mutant ans stained with antibodies against the Myc epitope tag, pericentrin and Centrin2, and the PCNT/CNT ratio determined in three independent experiments. Mean±s.d. plotted. *P<0.05; **P<0.01; ***P<0.001; ****P<0.0001; ns, not significant [unpaired t-test with Welch's correction (B,D,E) and two-way ANOVA with Tukey's multiple comparison (G–I)]. Ratios refer to number of spots for each signal. ε, 14-3-3ε; Sep, separase.
Fig. 7.
Fig. 7.
Model for regulation of centriole disengagement by 14-3-3ε. 14-3-3ε inhibits premature centriole disengagement by inhibiting the activity of Plk1 and separase. 14-3-3ε mutants showing increased or decreased affinity for Plk1 and separase, inhibiting disengagement or promoting premature centriole disengagement, respectively. Created in BioRender by Dalal, S., 2025. https://BioRender.com/z12e7mt. This figure was sublicensed under CC-BY 4.0 terms.

Similar articles

References

    1. Adon, A. M., Zeng, X., Harrison, M. K., Sannem, S., Kiyokawa, H., Kaldis, P. and Saavedra, H. I. (2010). Cdk2 and Cdk4 regulate the centrosome cycle and are critical mediators of centrosome amplification in p53-null cells. Mol. Cell. Biol. 30, 694-710. 10.1128/MCB.00253-09 - DOI - PMC - PubMed
    1. Agircan, F. G. and Schiebel, E. (2014). Sensors at centrosomes reveal determinants of local separase activity. PLoS Genet. 10, e1004672. 10.1371/journal.pgen.1004672 - DOI - PMC - PubMed
    1. Aitken, A. (2006). 14-3-3 proteins: a historic overview. Semin. Cancer Biol. 16, 162-172. 10.1016/j.semcancer.2006.03.005 - DOI - PubMed
    1. Andersen, J. S., Wilkinson, C. J., Mayor, T., Mortensen, P., Nigg, E. A. and Mann, M. (2003). Proteomic characterization of the human centrosome by protein correlation profiling. Nature 426, 570-574. 10.1038/nature02166 - DOI - PubMed
    1. Bahe, S., Stierhof, Y. D., Wilkinson, C. J., Leiss, F. and Nigg, E. A. (2005). Rootletin forms centriole-associated filaments and functions in centrosome cohesion. J. Cell Biol. 171, 27-33. 10.1083/jcb.200504107 - DOI - PMC - PubMed

MeSH terms

LinkOut - more resources