. 2025 Jul 8;166(9):bqaf114.
doi: 10.1210/endocr/bqaf114.

Canine Adrenomedullary and Pheochromocytoma Organoids: A Novel In Vitro Model

Affiliations

Canine Adrenomedullary and Pheochromocytoma Organoids: A Novel In Vitro Model

Marit F van den Berg et al. Endocrinology. .

Abstract

Context: Given the lack of effective medical treatment for pheochromocytomas (PCCs), a reliable in vitro model is needed to explore new therapies. Organoids are three-dimensional (3D) self-renewing structures that exhibit key features of their tissue of origin, providing valuable platforms for disease modeling and drug screening.

Objective: This study aimed to establish and characterize organoid cultures of canine normal adrenal medullas and PCCs.

Methods: Normal adrenal medullas from healthy dogs and tumor tissue from client-owned dogs with PCC were used to develop organoids. Primary cell suspensions were cultured in a 3D matrix, and organoids were established under optimized conditions. Organoids were characterized using histology, immunohistochemistry, immunofluorescence, qPCR, and metanephrine analysis by LC-MS/MS.

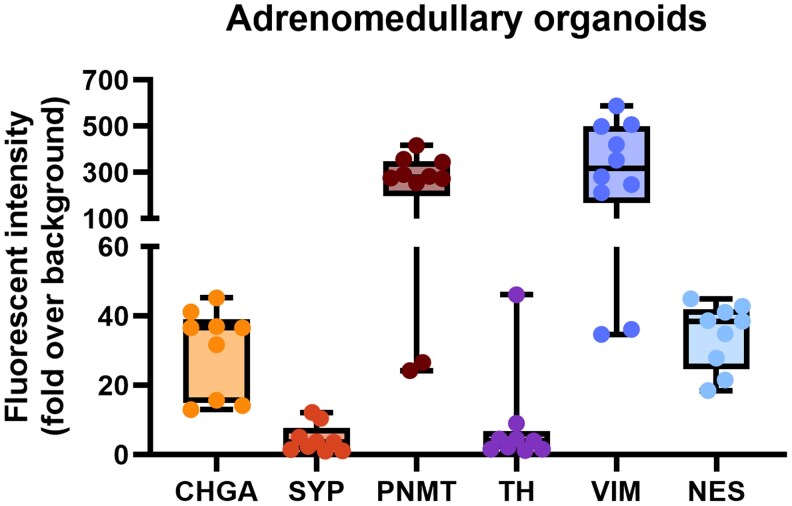
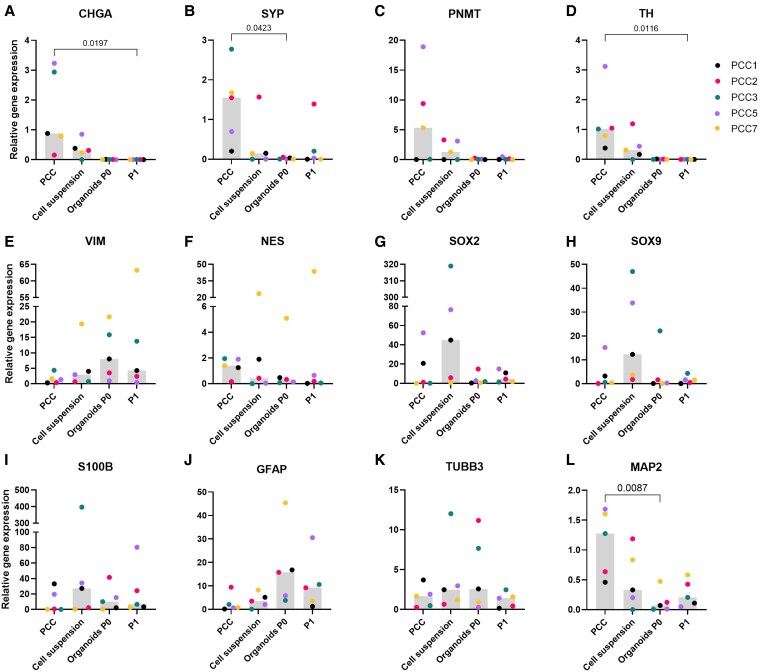
Results: Five adrenomedullary organoid lines were successfully established, demonstrating sustained growth. Organoid cultures were also derived from 9 PCCs, although expansion was limited after passages 1 to 2. Both adrenomedullary and PCC organoids expressed differentiation markers (chromogranin A, synaptophysin, phenylethanolamine N-methyltransferase) and stem/progenitor markers (nestin, SOX10). Organoids retained key functional traits, as indicated by metanephrine levels in culture supernatants, which initially mirrored primary tumor patterns. A decline in both differentiation marker expression and metanephrine levels was observed over time, possibly due to organoid dedifferentiation or selective loss of differentiated chromaffin cells.

Conclusion: This study demonstrates the establishment of the first adrenomedullary and PCC organoid lines. While further optimization is needed, these organoids offer valuable potential as an in vitro model to investigate PCC pathophysiology and explore novel treatment strategies for this therapeutically challenging tumor.

Keywords: adrenal; adrenal medulla; culture; dog; modeling.


Figures

Figure 1.
Figure 1.
Schematic representation of adrenomedullary and pheochromocytoma organoid formation and characterization. Tissues are dissociated into single-cell suspensions, embedded in basement membrane extract (BME), and seeded into droplets. Expansion medium is applied and refreshed regularly until organoids form. Organoids undergo characterization through histology, immunohistochemistry (IHC), immunofluorescence (IF), and quantitative real-time RT-PCR (qPCR). Metanephrine secretion is quantified in cell culture supernatants using liquid chromatography-tandem mass spectrometry (LC-MS/MS). Organoid cultures are maintained and expanded through passaging, which involves mechanical and enzymatic dissociation of the cellular structures. Created in BioRender. Galac, S. (2025) https://BioRender.com/jn7aotu.
Figure 2.
Figure 2.
Representative bright-field images of PCC9 in P0, showing the development of organoids from the initial plating of a cell suspension in a BME droplet through to passaging. On day 1, single chromaffin cells and small cell aggregates are visible within the BME droplet. By one week, cell clusters have increased in size, and some cells exhibit elongated, varicose extensions. Outside the BME droplet, migrating cells flatten and extend varicose processes (day 20). Over time, within the BME droplet, the clusters expand, densify, and interconnect to form a network that gradually contracts into a dense, compact cellular cluster (day 27). Simultaneously, small organoids emerge outside the BME droplet and at the site where the droplet detached from the bottom of the well, increasing in size and number. At later stages, both organoids and the dense cellular cluster are evident (day 34). Images were taken at 4× magnification, with insets at 20× for detailed visualization.
Figure 3.
Figure 3.
Representative bright-field images of NAM4 in P0 show the more rapid progression of organoid development compared to PCC organoid cultures. By day 11, cell clusters have formed and begun contracting into dense structures. By day 19, these clusters have expanded and interconnected, forming dense cellular clusters. By day 21, just before passaging, numerous organoids have formed. Images were taken at 4× magnification (scale bar: 250 µm), with insets at 20× for detailed visualization.
Figure 4.
Figure 4.
Bright-field images of canine PCC organoids derived from 2 PCCs (PCC3 and PCC4) across 4 consecutive passages (P0, P1, P2, and P3). Scale bars (where shown), 25 μm.
Figure 5.
Figure 5.
Bright-field images of canine adrenomedullary organoids across 6 consecutive passages (P0-P5). Images were taken at the same magnification. Scale bars (where shown), 50 μm.
Figure 6.
Figure 6.
Histology (A) and IHC staining for CHGA (B), SYP (C), SOX10 (D), VIM (E), NES (F), and Ki67 (G) in 2 primary tumors (PCC1 and PCC7) and their derived organoid lines at the end of passage 0. Scale bars (where shown), 100 μm.
Figure 7.
Figure 7.
Histology (A) and IHC staining for CHGA (B), SYP (C), SOX10 (D), VIM (E), NES (F), and Ki67 (G) of normal adrenomedullary tissue and adrenomedullary organoids (derived from NAM5) at the end of passage 0. Scale bars (where shown), 100 μm.
Figure 8.
Figure 8.
Representative immunofluorescence images of organoids derived from different PCCs, showing staining for differentiated chromaffin cell markers and progenitor/stem cell markers: NES and CHGA (A), TH and SYP (B), and PNMT and VIM (C). The specific markers are indicated at the top of each panel. Alexa Fluor 488- and Alexa Fluor 568-conjugated antibodies were used for detection, and nuclei were counterstained with DAPI. Scale bars represent 20 μm.
Figure 9.
Figure 9.
Representative immunofluorescence images of organoids derived from one adrenomedullary organoid line (NAM5), showing staining for differentiated chromaffin cell markers and progenitor/stem cell markers: NES and CHGA (A), TH and SYP (B), and PNMT and VIM (C). The specific markers are indicated at the top of each panel. Alexa Fluor 488- and Alexa Fluor 568-conjugated antibodies were used for detection, and nuclei were counterstained with DAPI. Scale bars represent 20 μm.
Figure 10.
Figure 10.
Whisker plots comparing the fold-over-background values for CHGA (A), SYP (B), PNMT (C), TH (D), VIM (E), and NES (F) in organoids derived from PCC3 (P0), PCC4 (P0), and PCC6 (P1). The fold-over-background values are expressed as the ratio of the mean fluorescence intensity of the organoid samples to the mean fluorescence intensity of the negative controls. Boxes span the interquartile range (ie, the second and third quartiles), and the line within the box represents the median fold change. Whiskers extend to the minimum and maximum values of the data, with each dot corresponding to a single organoid. The negative control organoids were exposed to the same secondary antibody combinations used for each respective staining, which consisted of Alexa Fluor™ 488 (anti-rabbit) and Alexa Fluor™ 568 (anti-mouse).
Figure 11.
Figure 11.
Whisker plots showing the fold-over-background values for CHGA, SYP, PNMT, TH, VIM, and NES in adrenomedullary organoids derived from NAM5 (P0). The fold-over-background values are expressed as the ratio of the mean fluorescence intensity of the organoid samples to the mean fluorescence intensity of the negative controls. Boxes span the interquartile range (ie, the second and third quartiles), and the line within the box represents the median fold change. Whiskers extend to the minimum and maximum values of the data, with each dot corresponding to a single organoid. The negative control organoids were exposed to the same secondary antibody combinations used for each respective staining, which consisted of Alexa Fluor™ 488 (anti-rabbit) and Alexa Fluor™ 568 (anti-mouse).
Figure 12.
Figure 12.
Relative gene expression levels of chromaffin cell markers CHGA (A), SYP (B), PNMT (C), and TH (D), adrenomedullary stem/progenitor markers VIM (E), NES (F), SOX2 (G), SOX9 (H), S100B (I) and GFAP (J), and neural markers TUBB3 (K) and MAP2 (L) were assessed in PCC tissues, cell suspensions, and 2 organoid passages (P0 and P1). Bars represent the median gene expression levels, while individual dots correspond to data from 5 PCCs (PCC1, PCC2, PCC3, PCC5, and PCC7). Statistical significance was determined using Friedman's test, followed by Dunn's post hoc correction for multiple comparisons. Significant differences between groups are indicated by the corresponding P values.
Figure 13.
Figure 13.
Relative gene expression levels of chromaffin cell markers CHGA (A), SYP (B), PNMT (C), and TH (D), adrenomedullary stem/progenitor markers VIM (E), NES (F), SOX2 (G), SOX9 (H), S100B (I), and GFAP (J), and neural markers TUBB3 (K) and MAP2 (L) were assessed in 3 adrenomedullary organoid lines (NAM2, NAM3, and NAM4) in various passages (P0, P1, and P2). Gene expression levels were compared to normal adrenal medulla tissue (from 7-10 samples), which were not related to the organoid lines. Bars represent the median gene expression levels, while individual dots correspond to data from the 3 adrenomedullary organoid lines. Statistical significance was determined using a Kruskal-Wallis test to compare differences between groups (normal medulla vs organoids and dense clusters across passages P0, P1, and P2), as the Friedman test could not be performed because normal medulla tissue and organoid lines were not matched. Dunn's post hoc correction for multiple comparisons was applied. Significant differences between groups are indicated by the corresponding P values.
Figure 14.
Figure 14.
The levels of normetanephrine (A), metanephrine (B), and 3-methoxytyramine (C) in the cell culture supernatant were measured in duplicate by LC-MS/MS for 5 PCCs at different timepoints. Data points represent mean concentrations ± SD. Measurements below the limit of quantification (LOQ) were plotted at their respective LOQ values: 0.025 nmol/L for normetanephrine, 0.02 for metanephrine, and 0.01 for 3-methoxytyramine. Negative control samples showed values below the LOQ for all metanephrines.

Similar articles

References

    1. Lenders JWM, Kerstens MN, Amar L, et al. Genetics, diagnosis, management and future directions of research of phaeochromocytoma and paraganglioma: a position statement and consensus of the Working Group on Endocrine Hypertension of the European Society of Hypertension. J Hypertens. 2020;38(8):1443‐1456. - PMC - PubMed
    1. Bayley JP, Devilee P. Advances in paraganglioma-pheochromocytoma cell lines and xenografts. Endocr Relat Cancer. 2020;27(12):R433‐R450. - PubMed
    1. Tischler AS, Favier J. Progress and challenges in experimental models for pheochromocytoma and paraganglioma. Endocr Relat Cancer. 2023;30(5):e220405. - PubMed
    1. Nölting S, Bechmann N, Taieb D, et al. Personalized management of pheochromocytoma and paraganglioma. Endocr Rev. 2022;43(2):199‐239. - PMC - PubMed
    1. Hescot S, Curras-Freixes M, Deutschbein T, et al. Prognosis of malignant pheochromocytoma and paraganglioma (MAPP-PronO study): a European network for the study of adrenal tumors retrospective study. J Clin Endocrinol Metab. 2019;104(6):2367‐2374. - PubMed

MeSH terms