

Dissecting Morphological and Functional Dynamics of Non-Tumorigenic and Triple-Negative Breast Cancer Cell Lines Using PCA and t-SNE Analysis
- PMID: 40576474
- PMCID: PMC12203836
- DOI: 10.1002/cnr2.70257
Dissecting Morphological and Functional Dynamics of Non-Tumorigenic and Triple-Negative Breast Cancer Cell Lines Using PCA and t-SNE Analysis
Abstract
Background: Triple-negative breast cancer (TNBC) poses significant challenges due to its aggressive nature and lack of targeted therapies. Understanding the cellular behaviors of TNBC is crucial for developing effective treatments.
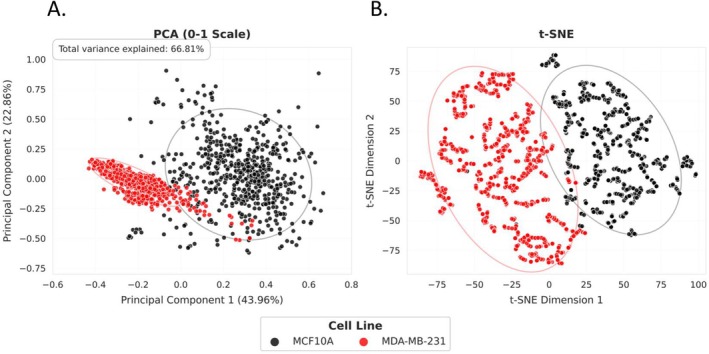
Aims: This study aims to compare the morphological characteristics of non-tumorigenic MCF10A and aggressive MDA-MB-231 TNBC cell lines using advanced analytical techniques.
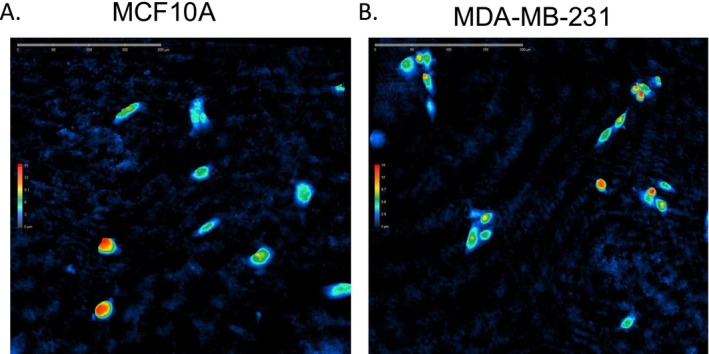
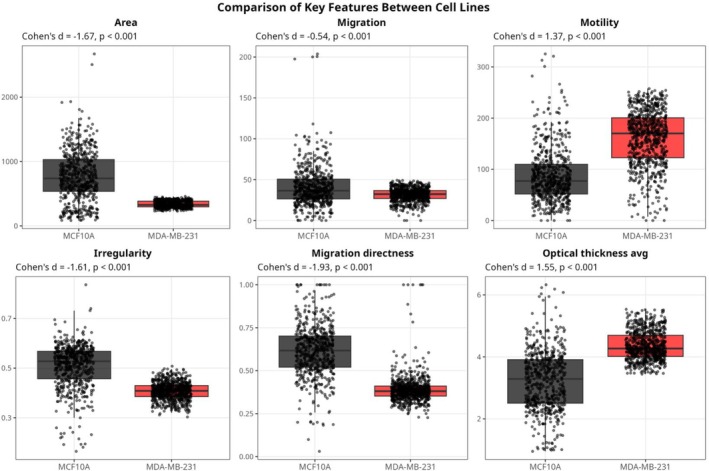
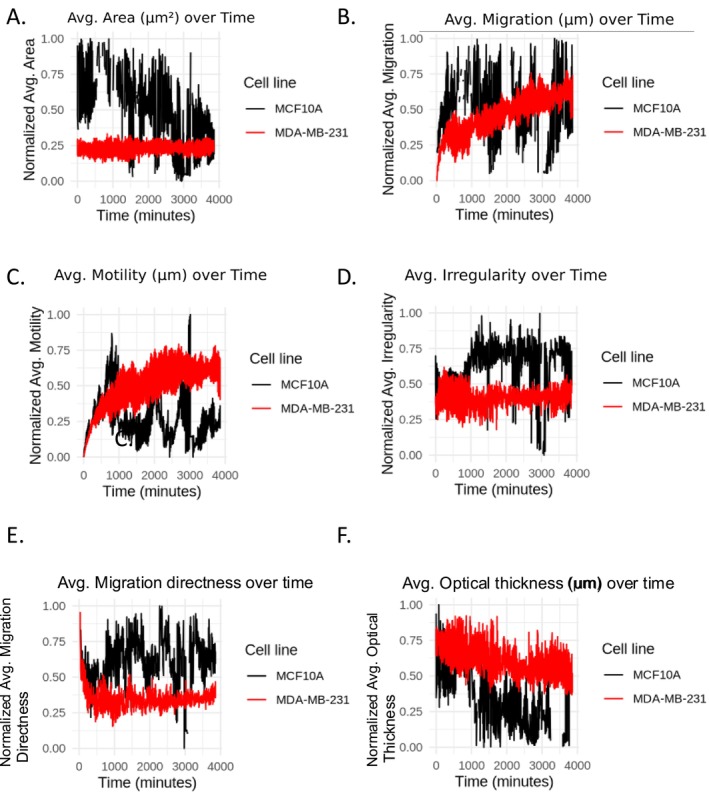
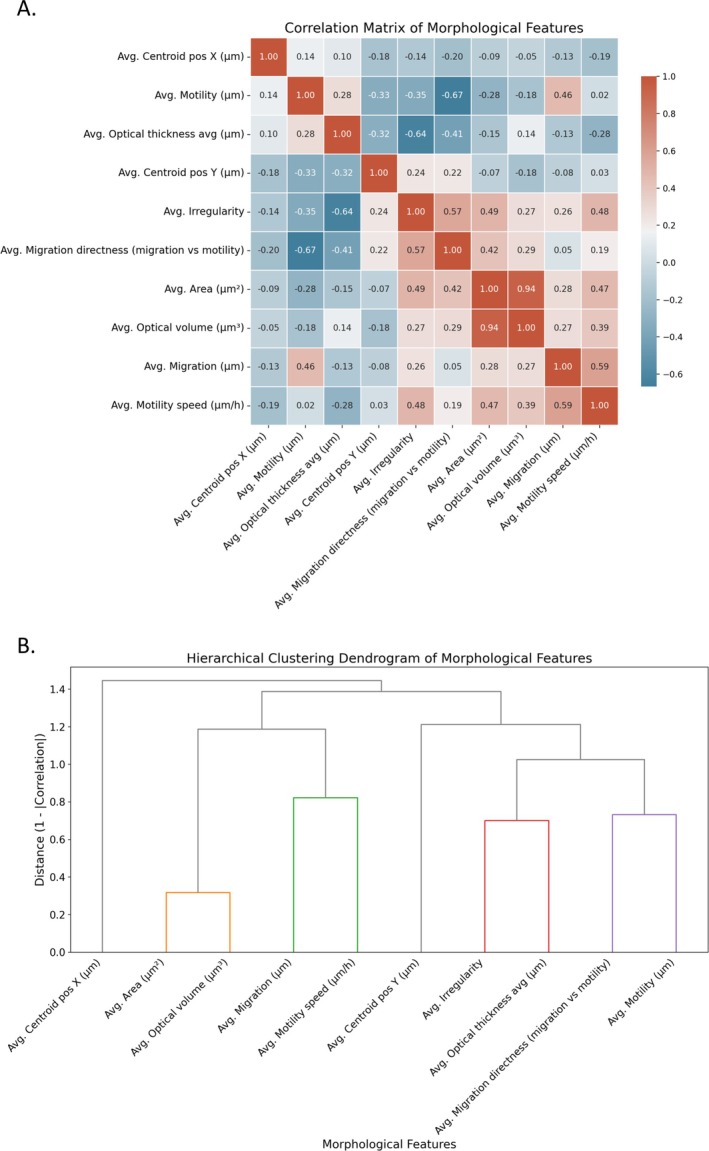
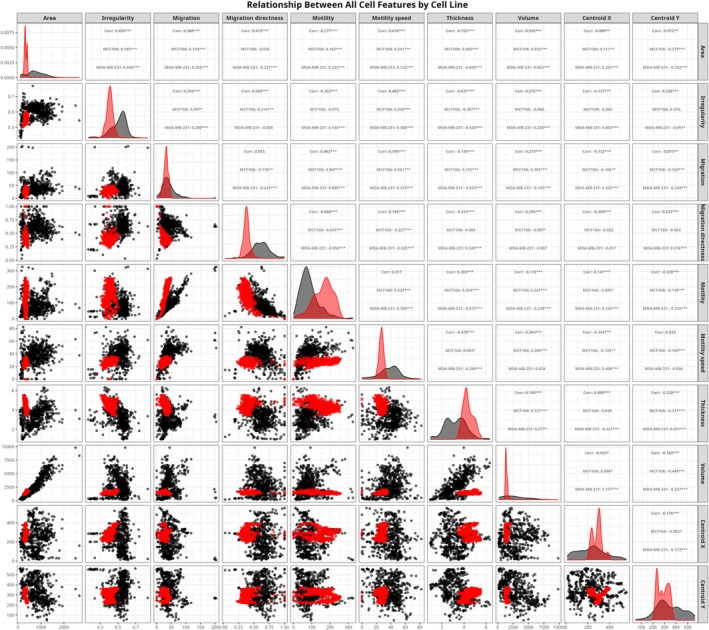
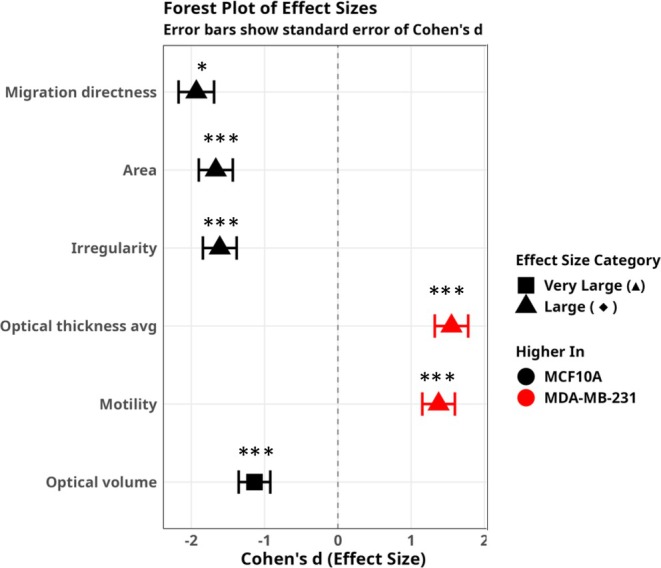
Methods and results: Advanced techniques such as Principal Component Analysis (PCA), t-Distributed Stochastic Neighbor Embedding (t-SNE), and digital holographic microscopy were utilized. Cellular features such as area, migration, motility, irregularity, and optical thickness were thoroughly analyzed over time. Our results revealed significant morphological differences between the MCF10A and MDA-MB-231 cell lines. Specifically, MDA-MB-231 cells displayed enhanced motility and a smaller, more variable size, attributes that may facilitate their invasive potential. In contrast, MCF10A cells exhibited larger sizes and more regular migration patterns, suggesting stability in structured tissue environments. Additionally, temporal analysis highlighted consistent phenotypic behaviors over time, with MDA-MB-231 cells demonstrating higher optical thickness and irregularity, indicating potential structural complexities associated with malignant transformation. Correlative analysis further confirmed these results by revealing connections between cell size, motility, and optical properties crucial for understanding cell behavior within their microenvironment.
Conclusion: The profound differences in cellular dynamics between MCF10A and MDA-MB-231 cell lines underscore the unique adaptive mechanisms of TNBC cells. Our study provides valuable insights into the cellular foundations of TNBC aggressiveness, offering a foundation for future research aimed at understanding the mechanistic underpinnings of TNBC progression and therapeutic targeting.
Keywords: MCF10A; MDA‐MB‐231; PCA; breast cancer; cell motility; digital holographic microscopy; temporal dynamics; triple‐negative breast cancer; t‐SNE.
© 2025 The Author(s). Cancer Reports published by Wiley Periodicals LLC.
Conflict of interest statement
The authors declare no conflicts of interest.
Figures
Similar articles
-
Unveiling miRNA30b's Role in Suppressing ADAM12 to Combat Triple-Negative Breast Cancer.Breast J. 2024 Oct 30;2024:5202941. doi: 10.1155/2024/5202941. eCollection 2024. Breast J. 2024. PMID: 39742357 Free PMC article.
-
Tumor Suppressor miRNA-based Signatures in Triple Negative Breast Cancer: A Study Based on Big Data Analysis of Gene Expression Omnibus (GEO) Datasets and Its Validation.Asian Pac J Cancer Prev. 2025 Jun 1;26(6):2087-2095. doi: 10.31557/APJCP.2025.26.6.2087. Asian Pac J Cancer Prev. 2025. PMID: 40542771
-
Single-cell ligand-receptor profiling reveals an immunotherapy-responsive subtype and prognostic signature in triple-negative breast cancer.Front Immunol. 2025 Jun 10;16:1590951. doi: 10.3389/fimmu.2025.1590951. eCollection 2025. Front Immunol. 2025. PMID: 40557143 Free PMC article.
-
Pembrolizumab plus chemotherapy for first-line treatment of advanced triple-negative breast cancer.Future Oncol. 2024;20(22):1587-1600. doi: 10.2217/fon-2023-0301. Epub 2024 Apr 10. Future Oncol. 2024. PMID: 38597713 Free PMC article.
-
Triple negative breast cancer - prognostic role of immune-related factors: a systematic review.Acta Oncol. 2018 Jan;57(1):74-82. doi: 10.1080/0284186X.2017.1400180. Epub 2017 Nov 23. Acta Oncol. 2018. PMID: 29168430
References
-
- Cruz‐Lozano M., “Targeted Therapies in Triple Negative Breast Cancer: Current Knowledge and Perspectives,” (2019).
MeSH terms
Grants and funding
LinkOut - more resources
Full Text Sources
Miscellaneous
