. 2025 Jun 27;82(1):257.
doi: 10.1007/s00018-025-05759-w.

Glycosphingolipid synthesis is impaired in SLC35A2-CDG and improves with galactose supplementation

Affiliations

Glycosphingolipid synthesis is impaired in SLC35A2-CDG and improves with galactose supplementation

Andrea Jáñez Pedrayes et al. Cell Mol Life Sci. .

Abstract

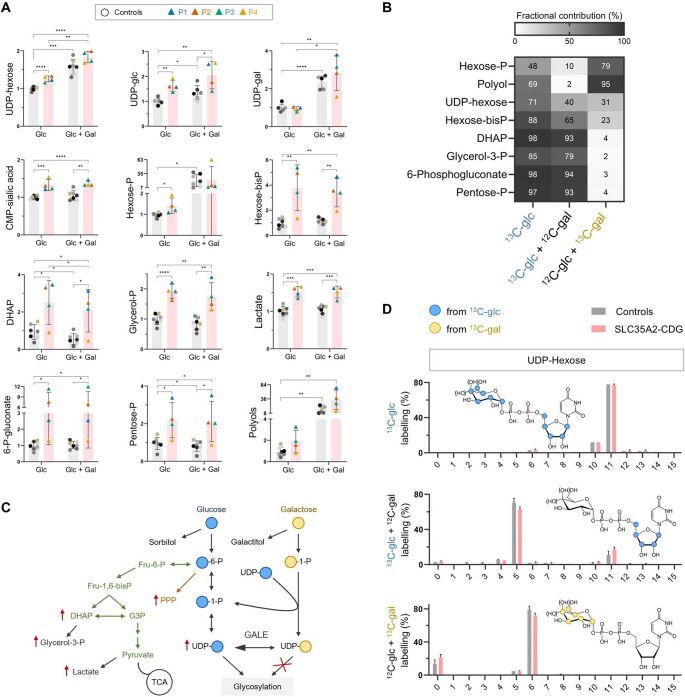
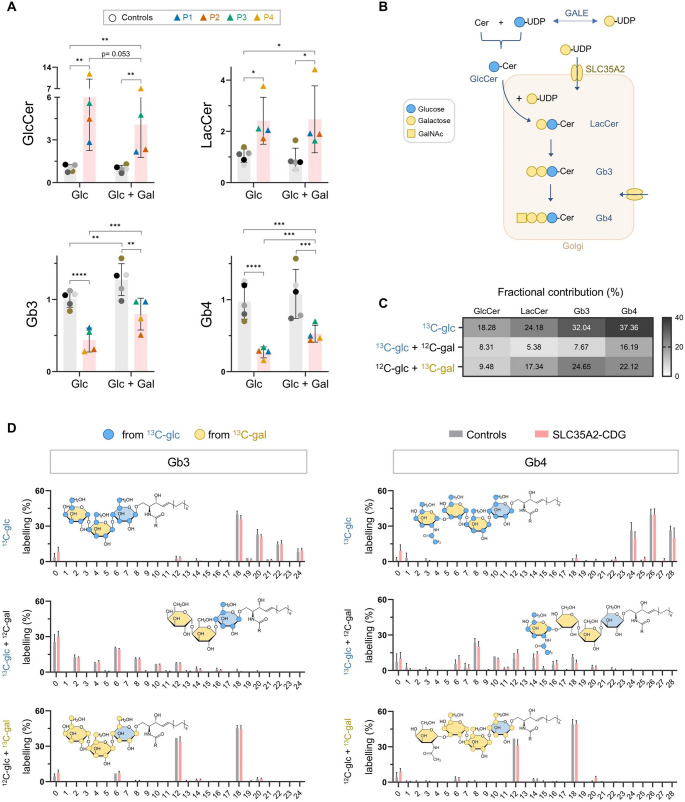
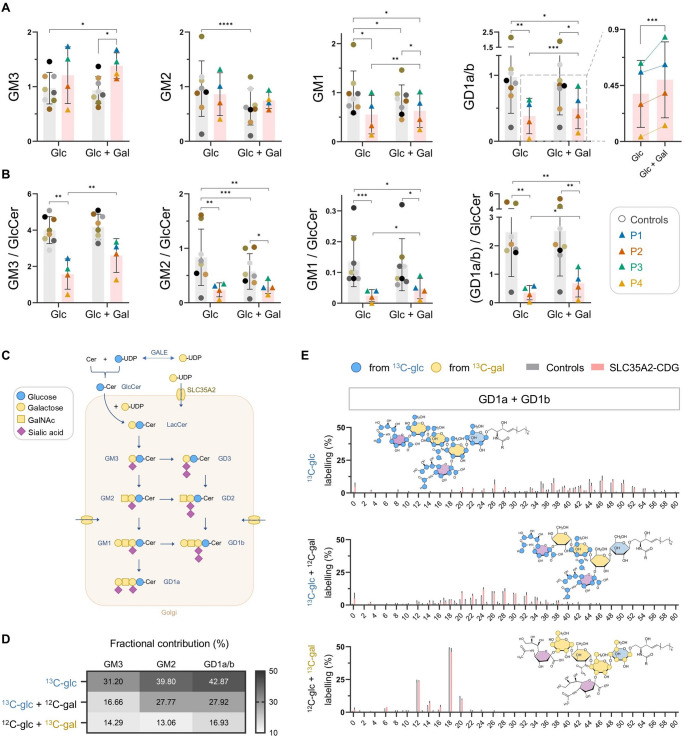
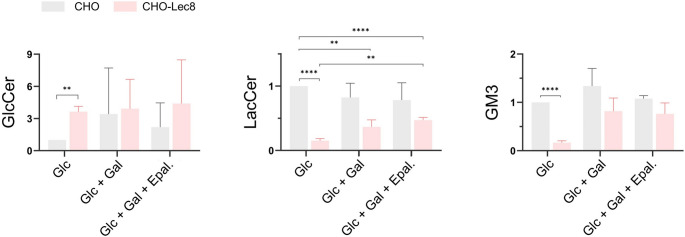
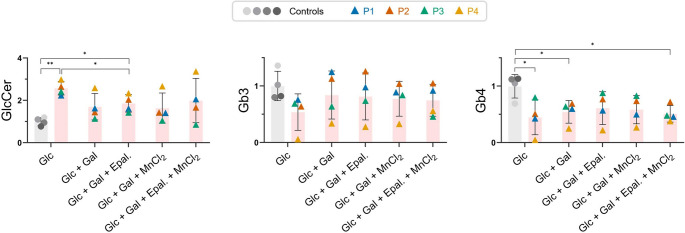
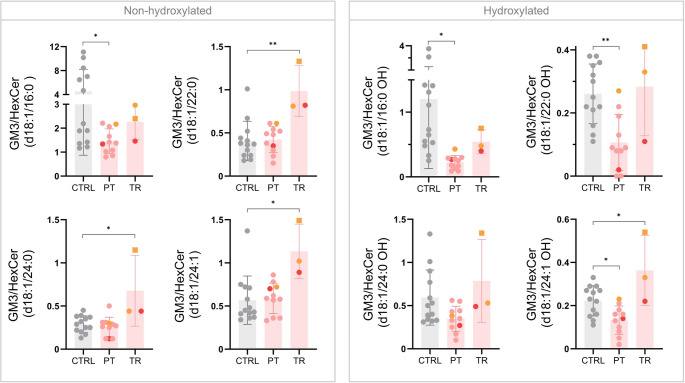
SLC35A2-CDG is an X-linked congenital disorder of glycosylation (CDG), characterized by defective UDP-galactose transport into the Golgi and endoplasmic reticulum and consequent insufficient galactosylation of glycans. Clinically, this translates into a range of predominantly neurological symptoms. Although the pathomechanism of this disorder is not fully understood, oral galactose supplementation has led to clinical and biochemical improvement in some patients. Here, we show that protein glycosylation (N- and O-linked) was only minimally disturbed in SLC35A2-CDG patient-derived fibroblasts. However, lipid glycosylation was significantly impaired, with accumulation of glucosylceramide and deficiency of digalactosylated glycosphingolipids (GSLs) and complex gangliosides. Galactose supplementation increased UDP-galactose, its transport into the Golgi, and improved deficient GSL synthesis through direct incorporation of the provided galactose. This improved GSL homeostasis in all patient-derived fibroblasts and in another SLC35A2 deficient cell model (CHO-Lec8). Additionally, SLC35A2-CDG serum analysis identified hydroxylated GSLs, particularly GM3, as potential disease biomarkers. Given the essential role of gangliosides in central nervous system function, their deficiency is likely a key factor in the neurological involvement of this disorder. These findings pave the way for new nutritional therapies with GSL supplements and highlight the importance of studying lipid glycosylation to better understand the complex pathophysiology of CDG.

Keywords: CDG; GSL; Gangliosides; Glycosphingolipids; SLC35A2-CDG; Tracer metabolomics.


Conflict of interest statement

Declarations. Ethics approval: The study was conducted in accordance with the Declaration of Helsinki and was approved by the ethical committee of the University Hospitals of Leuven. Fibroblast and serum analyses were performed in accordance with ethics application number S60206 (“Retrospective metabolic analysis of archived fibroblasts”) and S68513 (“Glycosphingolipid analysis in serum samples from individuals with inborn errors of metabolism”). Consent for publication: All the authors agree to publication. Competing interests: The authors have no relevant financial or non-financial interests to disclose.

Figures

Fig. 1
Fig. 1
Study of the central carbon metabolism and nucleotide sugars in SLC35A2-CDG fibroblasts by LC-MS. (A) Relative abundances of central carbon metabolites and nucleotide sugars in control (C1-C7; technical n = 3–6) and SLC35A2-CDG fibroblasts (P1-P4; technical n = 3–12) cultured in glucose (glc)-only medium or with galactose (gal) supplementation (Glc + Gal). Abundances are relative to controls on glucose. (B) Fractional contribution of 13C-glc and 13C-gal to central carbon metabolites and UDP-hexose in SLC35A2-CDG fibroblasts (P2, P3) cultured with or without galactose. (C) Schematic representation of the metabolic rewiring in SLC35A2-CDG. (D) Isotopologue profiling in UDP-hexose in control (C1, C2) and SLC35A2-CDG fibroblasts (P2, P3) cultured with 13C-glc or 13C-gal. X axis represents the number of carbons derived from the labeled nutrient. Blue and yellow circles show the sugars deriving predominantly from 13C-glc or 13C-gal in each condition. Hydroxyl groups in parentheses represent alternative positions, where one corresponds to UDP-glc and the other to UDP-gal. Data are represented as the mean ± SD. *p ≤ 0.05; **p ≤ 0.01; ***p ≤ 0.001; ****p ≤ 0.0001. DHAP: Dihydroxyacetone phosphate, G3P: Glyceraldehyde 3-phosphate, PPP: Pentose phosphate pathway, TCA: Tricarboxylic acid cycle
Fig. 2
Fig. 2
Study of neutral glycosphingolipids (GSLs) in SLC35A2-CDG fibroblasts by LC-MS. (A) Relative abundances of neutral GSLs in control (C1-C5; technical n = 3–9) and SLC35A2-CDG fibroblasts (P1-P4; technical n = 3–9) cultured in glucose (glc)-only medium or with galactose (gal) supplementation (Glc + Gal). Abundances are relative to controls on glucose. Graphs show the average of the most abundant GSL species (d18:1/16:0, d18:1/22:0, d18:1/24:0 and d18:1/24:1). Individual graphs for each species can be found in Fig. S5. (B) Schematic representation of neutral GSL synthesis. (C) Fractional contribution of 13C-glc and 13C-gal to neutral GSLs in SLC35A2-CDG fibroblasts (P2, P3) cultured with or without galactose. (D) Isotopologue profiling in Gb3 and Gb4 in control (C1, C2) and SLC35A2-CDG fibroblasts (P1-P3) cultured with 13C-glc or 13C-gal. X axis represents the number of carbons derived from the labeled nutrient. Blue and yellow circles show the carbons in the sugars deriving predominantly from 13C-glc or 13C-gal in each condition. Data are represented as the mean ± SD. *p ≤ 0.05; **p ≤ 0.01; ***p ≤ 0.001; ****p ≤ 0.0001. GlcCer: Glucosylceramide, LacCer: Lactosylceramide
Fig. 3
Fig. 3
Ganglioside analysis in SLC35A2-CDG fibroblasts by LC-MS. (A) Ganglioside relative abundances in control (C1-C8; technical n = 1–3) and SLC35A2-CDG fibroblasts (P1-P4; technical n = 3) cultured in glucose (glc)-only medium or with galactose (gal) supplementation (Glc + Gal). Abundances are relative to controls on glucose. Graphs show the average of the most abundant species (d18:1/16:0, d18:1/22:0, d18:1/24:0 and d18:1/24:1). Individual graphs for each species can be found in Fig. S6. (B) Ganglioside/GlcCer ratios of control (C1-C8; technical n = 1–3) and SLC35A2-CDG fibroblasts (P1-P4; technical n = 3) with or without galactose. Ratios were calculated with the raw MS data normalized to the internal standard and protein content per sample. Graphs showing individual points for each experiment, as well as the ratios of the rest of glycosphingolipids, can be found in Fig. S7. (C) Schematic representation of ganglioside synthesis. (D) Fractional contribution of 13C-glc and 13C-gal to different gangliosides in SLC35A2-CDG fibroblasts cultured with or without galactose. (E) Isotopologue profiling in GD1a/b in control and SLC35A2-CDG fibroblasts cultured with or without galactose and treated with 13C-glc or 13C-gal. X axis represents the number of carbons derived from the labeled nutrient. Blue and yellow circles show the carbons in the sugars deriving predominantly from 13C-glc or 13C-gal in each condition. In untreated conditions, sugars composing GD1a/b derive from glucose (3 × 6 C + 2 × 11 C + 8 C = 48 C). Galactose treatment results in 13C-gal labeling of two (12 C) or three (18 C) hexoses and 13C-glc labeling in the ceramide moiety, GalNAc and sialic acid. Data are represented as the mean ± SD. *p ≤ 0.05; **p ≤ 0.01; ***p ≤ 0.001; ****p ≤ 0.0001. GlcCer: Glucosylceramide
Fig. 4
Fig. 4
Glycosphingolipid (GSL) analysis in CHO and CHO-Lec8 cells. Relative abundances of GlcCer, LacCer and GM3 in CHO and CHO-Lec8 cells (technical n = 3) cultured in glucose (glc)-only medium, with galactose (gal) supplementation (Glc + Gal) or with galactose and epalrestat (Glc + Gal + Epal). Abundances are relative to CHO cells on glucose. Graphs show the average of the most abundant GSL species (d18:1/16:0, d18:1/22:0, d18:1/24:0 and d18:1/24:1). Data are represented as the mean ± SD. *p ≤ 0.05; **p ≤ 0.01; ***p ≤ 0.001; ****p ≤ 0.0001. GlcCer: Glucosylceramide, LacCer: Lactosylceramide
Fig. 5
Fig. 5
Glycosphingolipid (GSL) analysis in SLC35A2-CDG fibroblasts after different treatments. Relative abundances of GlcCer, Gb3 and Gb4 in control (C1-C4, technical n = 3) and SLC35A2-CDG patient (P1-P4, technical n = 3) fibroblasts cultured in glucose (glc)-only medium, with galactose (gal) supplementation (Glc + Gal) or with combination therapies of galactose with epalrestat (Epal.), manganese (MnCl2), or both. Abundances are relative to controls on glucose. Graphs show the average of the most abundant GSL species (d18:1/16:0, d18:1/22:0, d18:1/24:0 and d18:1/24:1). Data are represented as the mean ± SD. *p ≤ 0.05; **p ≤ 0.01; ***p ≤ 0.001. GlcCer: Glucosylceramide
Fig. 6
Fig. 6
Serum analysis in SLC35A2-CDG by LC-MS. GM3/HexCer ratios of untreated (PT) and treated with galactose (TR) SLC35A2-CDG patients compared to age-matched controls (CTRL). Treated samples are color coded (red or orange) to correlate them to the corresponding untreated sample. The orange square is the sample of the same patient represented with the orange circle after combination therapy of galactose and uridine. Ratios were calculated with the raw MS data normalized to the internal standard. Quantitative analysis of both HexCer and GM3 species can be found in Table S3. Data are represented as the mean ± SD. *p ≤ 0.05; **p ≤ 0.01; ***p ≤ 0.001. HexCer: Hexosylceramide

References

    1. Ng BG, Buckingham KJ, Raymond K et al (2013) Mosaicism of the UDP-Galactose transporter SLC35A2 causes a congenital disorder of glycosylation. Am J Hum Genet 92:632–636. 10.1016/j.ajhg.2013.03.012 - PMC - PubMed
    1. Kabuß R, Ashikov A, Oelmann S et al (2005) Endoplasmic reticulum retention of the large splice variant of the UDP-galactose transporter is caused by a Dilysine motif. Glycobiology 15:905–911. 10.1093/glycob/cwi085 - PubMed
    1. Kodríková R, Pakanová Z, Krchňák M et al (2023) N-Glycoprofiling of SLC35A2-CDG: patient with a novel hemizygous variant. Biomedicines 11:580. 10.3390/biomedicines11020580 - PMC - PubMed
    1. Witters P, Tahata S, Barone R et al (2020) Clinical and biochemical improvement with galactose supplementation in SLC35A2-CDG. Genet Med 22:1102–1107. 10.1038/s41436-020-0767-8 - PMC - PubMed
    1. Dörre K, Olczak M, Wada Y et al (2015) A new case of UDP-galactose transporter deficiency (SLC35A2‐CDG): molecular basis, clinical phenotype, and therapeutic approach. J Inherit Metab Dis 38:931–940. 10.1007/s10545-015-9828-6 - PubMed

MeSH terms

LinkOut - more resources