. 2025 Jun 27;20(6):e0325363.
doi: 10.1371/journal.pone.0325363. eCollection 2025.

Hepatitis B virus X protein (HBx)-mediated immune modulation and prognostic model development in hepatocellular carcinoma

Affiliations

Hepatitis B virus X protein (HBx)-mediated immune modulation and prognostic model development in hepatocellular carcinoma

Jianhua Zhong et al. PLoS One. .

Abstract

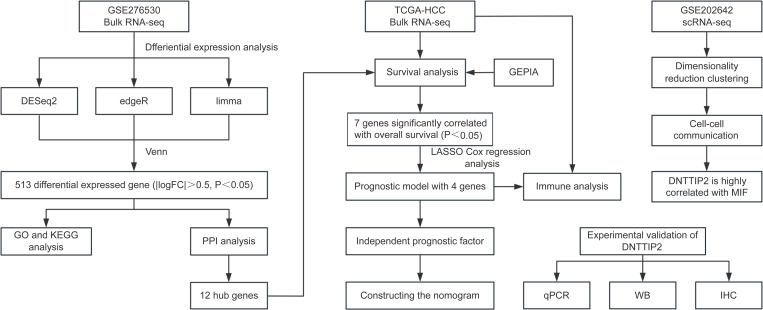
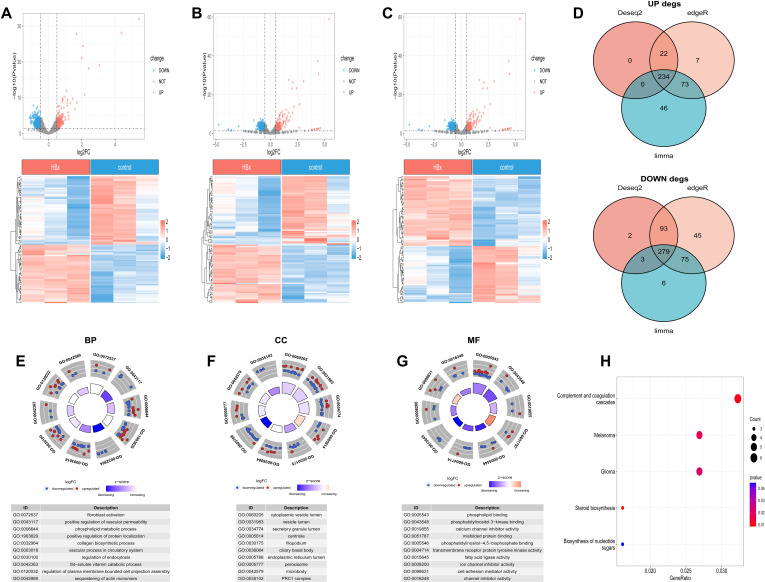
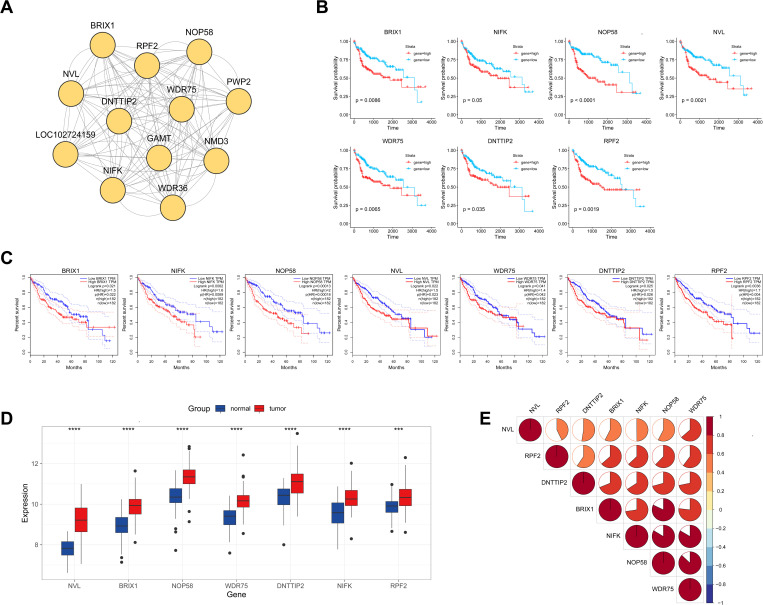
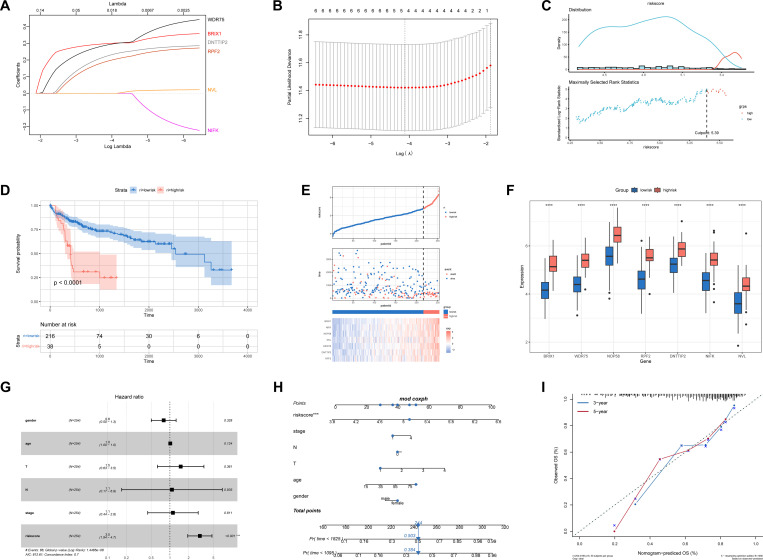
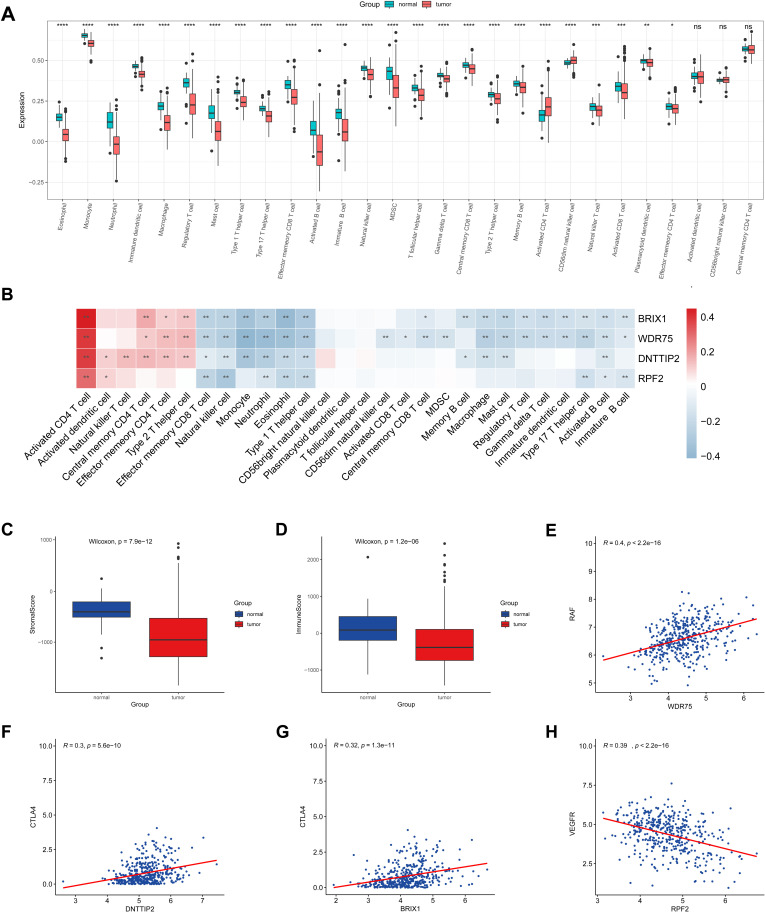
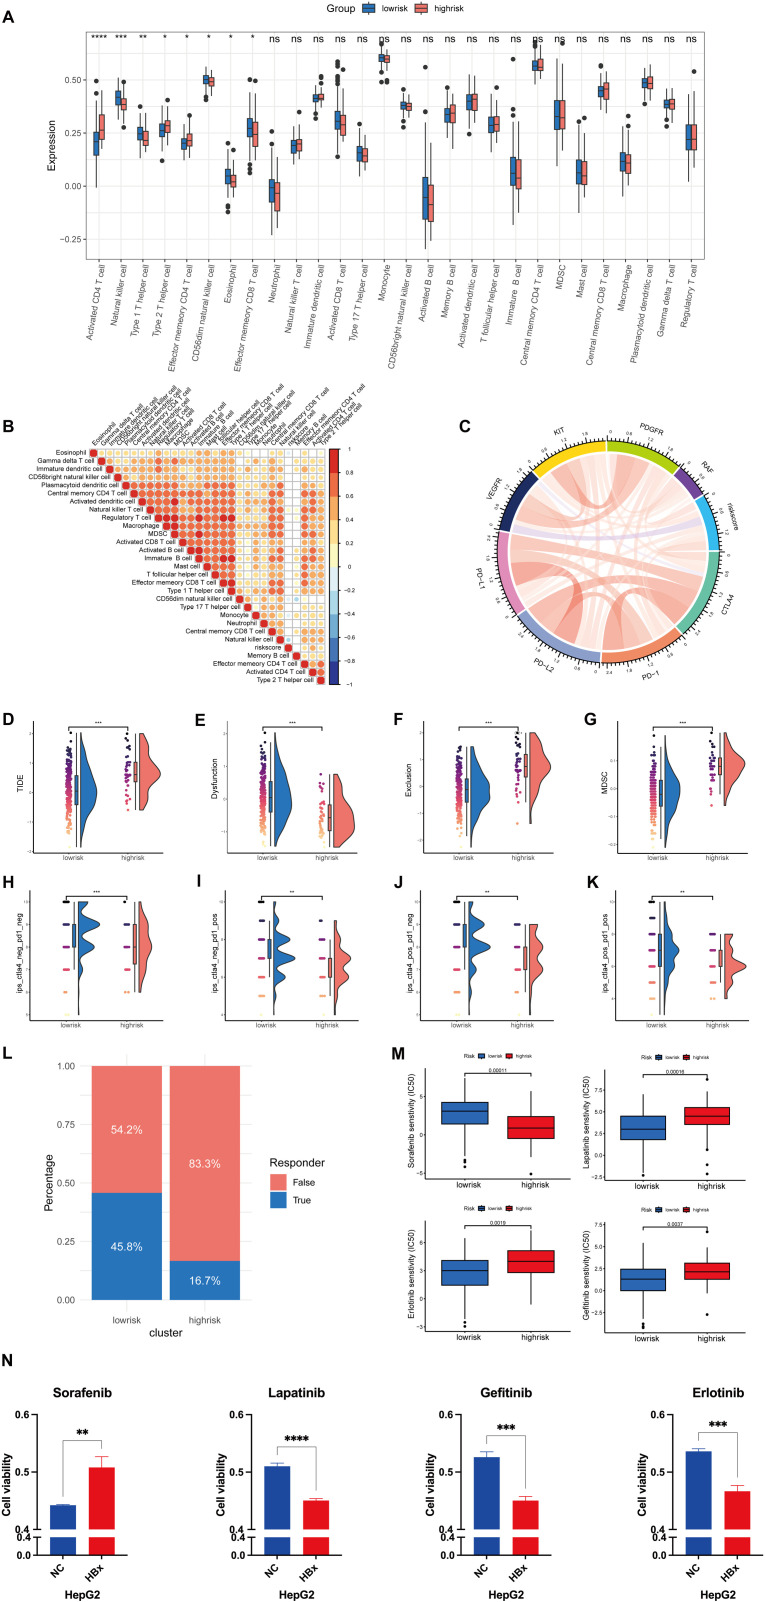
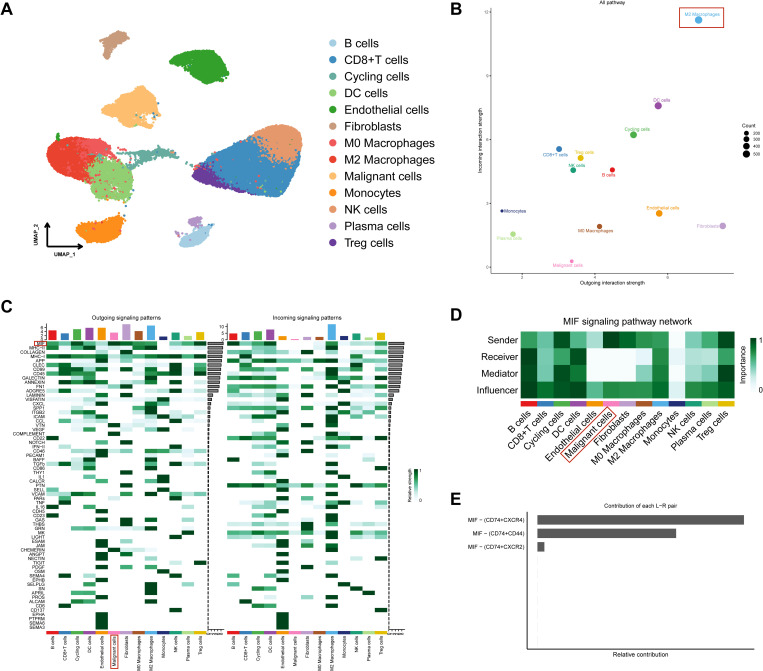
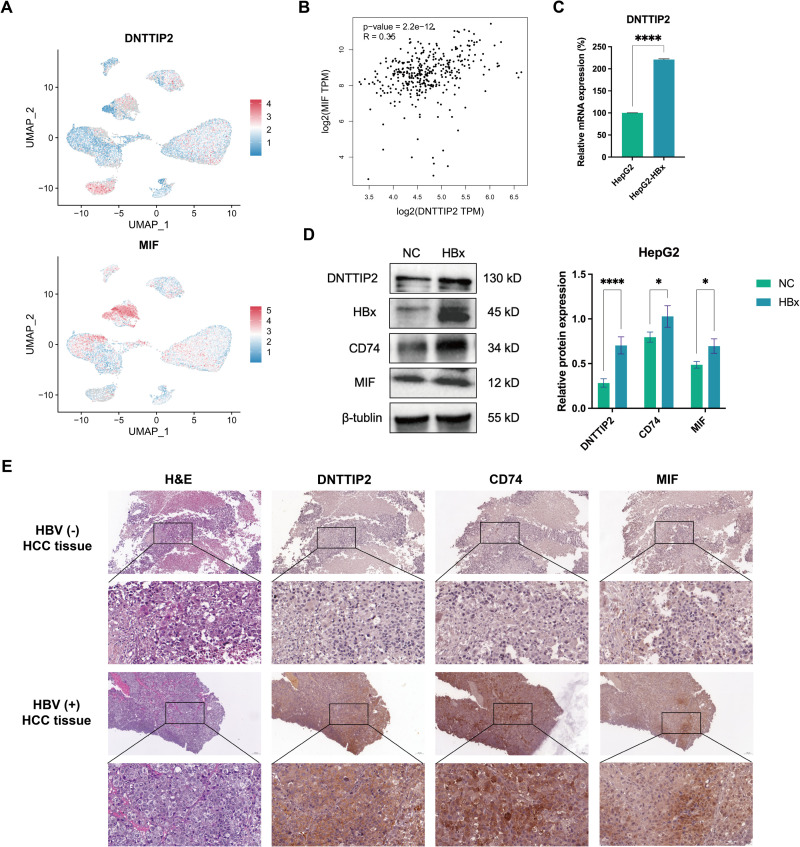
Hepatitis B virus (HBV) X protein (HBx) is critical in hepatocellular carcinoma (HCC) development, but its influence on tumor immunity and the tumor microenvironment (TME) remains unclear. This study aimed to construct a prognostic model based on HBx-related genes and explore their relationship with immune infiltration and immunotherapy response. Through transcriptome sequencing of our HBx-expressing HepG2 cells and analysis of HCC patient data from the cancer genome atlas (TCGA) and genotype-tissue expression (GTEx), we identified seven HBx-related genes, nuclear VCP-like (NVL), WD repeat domain 75 (WDR75), NOP58 nucleolar protein (NOP58), Brix domain-containing protein 1 (BRIX1), deoxynucleotidyltransferase terminal interacting protein 2 (DNTTIP2), MKI67 FHA domain interacting nucleolar phosphoprotein (NIFK), and ribosome production factor 2 (RPF2), associated with poor prognosis. LASSO Cox regression narrowed these to four key genes (BRIX1, RPF2, DNTTIP2, and WDR75), which were used to develop a prognostic riskscore signature. High-risk patients exhibited lower survival rates, decreased infiltration of anti-tumor immune cells, poorer responses to immunotherapy, and increased immune evasion. Among the four genes, DNTTIP2 showed higher expression in single-cell data, was linked to migration inhibitory factor (MIF) signaling, and may play a pivotal role in shaping an immunosuppressive TME. Elevated DNTTIP2 expression was confirmed in HBx-expressing HepG2 cells and HBV-infected HCC samples. This study highlights a novel HBx-related four-gene prognostic model that predicts clinical outcomes, immune infiltration, and immunotherapy response, offering insights into HCC progression and potential therapeutic targets.


Conflict of interest statement

The authors have declared that no competing interests exist.

Figures

Fig 1
Fig 1. Workflow chart of the study.
Fig 2
Fig 2. DEGs and enrichment analysis in HepG2 cells expressing HBx.
A-C Volcano plot and heatmap of DEGs in (A) Deseq2, (B) edgeR, (C) limma. D Venn diagrams showed the number of upregulated and downregulated. E-G The enriched GO terms of DEGs: (E) Biological Process, (F) Cellular Component, and (G) Molecular Function. Red and blue dots represent upregulated and downregulated genes based on log2FC. Inner box color indicates pathway z-score, and box size reflects enrichment significance. H KEGG pathway enrichment results of DEGs.
Fig 3
Fig 3. PPI Network Analysis, Hub DEGs Identification, and Survival Analysis in HCC.
A A key cluster with 12 genes by MCODE based on the PPI network. B KM-plot of prognostic HBx-related hub genes based on TCGA cohort. C KM-plot of prognostic HBx-related hub genes based on GEPIA. D The expression of prognostic hub DEGs in the normal and tumor tissues (***P < 0.001, (****P < 0.001). E The correlation between the seven prognostic hub DEGs using Spearman analyses. Positive correlation was marked with red. Colors represent different ranges of Pearson correlation coefficients (e.g., dark red indicates R = 0.8 - 1.0). The colored areas are categorized based on correlation strength, not proportionally scaled to the R value.
Fig 4
Fig 4. Construction and prognostic value of the riskscore signature.
A Selection of the optimal parameter (lambda) in the LASSO model. B LASSO coefficients of the 7 hub DEGs in TCGA cohort. C The optimal cut-off point to divide riskscore into low and high groups was 5.39294. The height of each column in the histogram represents the number of patients within the corresponding riskscore range. D Overall survival analysis for the low-risk and high-risk groups in TCGA cohort. E The mortality risk in the low-risk and high-risk group patients in the TCGA cohort. F The hub DEGs expressed in the low-risk and high-risk groups (****P < 0.0001). G Multivariate Cox analysis for the clinicopathologic characteristics and riskscore in TCGA cohort. H A nomogram to predict the prognostic of HCC patients. I Calibration plots showing the probability of 3-, and 5-year overall survival in TCGA cohort. The 45-degree line represented the ideal prediction.
Fig 5
Fig 5. TME immune cell infiltration and correlation between LASSO and therapeutic target genes.
A Enrichment scores of TME infiltration cells in normal liver versus HCC tissues. Higher scores represent higher levels of immune cell infiltration. B The correlation between LASSO genes and TME infiltration cells. Red, positive; Blue, negative. C The boxplot of stromal score. D The boxplot of immune score. E The correlation between WDR75 expression and RAF expression. F The correlation between DNTTIP2 expression and CTLA4 expression. G The correlation between BRIX1 expression and CTLA4 expression. H The correlation between RPF2 expression and VEGFR expression. (*P < 0.05; **P < 0.01; ***P < 0.001; ****P < 0.0001).
Fig 6
Fig 6. Immune landscape and drug sensitivity in high-risk and low-risk groups.
A Differences in TME infiltration cells between high-risk and low-risk groups. Enrichment scores represent the relative abundance of immune cell infiltration; higher scores indicate greater infiltration levels. B The correlation between riskScore and TME immune cell types. The size of each dot corresponds to the absolute risk score (|R|), with larger dots indicating stronger correlations. C The correlation between riskScore and genes targeted by immunotherapy or targeted therapy. The width of the chords represents the strength of the correlation, with wider connections indicating higher |R| values. D-G Alteration of (D) TIDE score, (E) immune dysfunction, (F) immune exclusion and (G) MDSC in high-risk and low-risk groups. H-K IPS scores of PD1 and CTLA4 in high-risk and low-risk groups. Low IPS scores in high-risk tumors suggest poor response to immune checkpoint inhibitors, while higher IPS scores in low-risk tumors suggest a better response. (H) Negative response to PD1 treatment and CTLA4 treatment [CTLA(-)PD1(-)]. (I) Positive response to PD1 treatment and negative response to CTLA4 treatment [CTLA(-)PD1(+)]. (J) Negative response to PD1 treatment and positive response to CTLA4 treatment [CTLA(+)PD1(-)]. (K) Positive response to PD1 treatment and CTLA4 treatment [CTLA(+)PD1(+)]. L The cohort distribution of immunotherapy response between high-risk and low-risk groups within the TCGA dataset. M Sensitivity analyses of sorafenib, lapatinib, erlotinib, and gefitinib in high-risk and low-risk groups. N Cell viability of HepG2 cells transfected with control (NC) or HBx plasmid after treatment with sorafenib, lapatinib, gefitinib, and erlotinib. (*P < 0.05; **P < 0.01; ***P < 0.001; ****P < 0.0001).
Fig 7
Fig 7. Identification of HBV-related HCC cell subtypes and inference of cell-cell communications in TME.
A The UMAP plot shows different cell types in HBV-related HCC tissues. B Illustration of the incoming and outgoing interaction strengths for each cell type. C The incoming and outgoing signaling pathways of each cell type. D The heatmap shows the communication probability of the MIF signaling pathway. E Contribution of each ligand-receptor(L-R) pair in the MIF signaling pathway.
Fig 8
Fig 8. Correlation of DNTTIP2 with MIF and verification of DNTTIP2, MIF and CD74 expression in HBV-related hepatocellular carcinoma.
A Gene expression levels of DNTTIP2 and MIF in GSE202642 dataset. B Correlation between DNTTIP2 and MIF expression based on TCGA cohort. C Expression of DNTTIP2 mRNA in HepG2 cells transfected with HBx plasmid or control plasmid (NC). D Expression of DNTTIP2, CD74 and MIF protein after transfection with HBx plasmid and control plasmid (NC) in HepG2 cells. E Representative images of H&E staining and IHC staining of HBV-negative and HBV-positive HCC tissue. IHC staining was performed to detect DNTTIP2, MIF, and CD74 expression. Brown staining indicates positive expression. Scale bars, 100 μm and 20 μm. Data presented as mean ± SEM (n = 3). *P < 0.05; **P < 0.01; ***P < 0.001; ****P < 0.0001.

Similar articles

References

    1. Bray F, Ferlay J, Soerjomataram I, Siegel RL, Torre LA, Jemal A. Global cancer statistics 2018: GLOBOCAN estimates of incidence and mortality worldwide for 36 cancers in 185 countries. CA Cancer J Clin. 2018;68(6):394–424. doi: 10.3322/caac.21492 - DOI - PubMed
    1. Yang JD, Hainaut P, Gores GJ, Amadou A, Plymoth A, Roberts LR. A global view of hepatocellular carcinoma: trends, risk, prevention and management. Nat Rev Gastroenterol Hepatol. 2019;16(10):589–604. doi: 10.1038/s41575-019-0186-y - DOI - PMC - PubMed
    1. Yang JD, Roberts LR. Epidemiology and management of hepatocellular carcinoma. Infect Dis Clin North Am. 2010;24(4):899–919, viii. doi: 10.1016/j.idc.2010.07.004 - DOI - PMC - PubMed
    1. Martyn E, Eisen S, Longley N, Harris P, Surey J, Norman J, et al. The forgotten people: Hepatitis B virus (HBV) infection as a priority for the inclusion health agenda. Elife. 2023;12:e81070. doi: 10.7554/eLife.81070 - DOI - PMC - PubMed
    1. Jiang Y, Han Q, Zhao H, Zhang J. The mechanisms of HBV-induced hepatocellular carcinoma. J Hepatocell Carcinoma. 2021;8. - PMC - PubMed

MeSH terms

Substances