Evaluating the potential of underwater television to contribute to marine litter assessments alongside bottom trawling
- PMID: 40577390
- PMCID: PMC12204539
- DOI: 10.1371/journal.pone.0324900
Evaluating the potential of underwater television to contribute to marine litter assessments alongside bottom trawling
Abstract
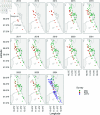
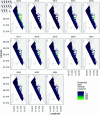
Marine litter presents a global threat to marine ecosystems, human health, and safety. Therefore, it is important to increase our knowledge about spatiotemporal trends of litter in the environment. Bottom trawl surveys provide a practical method for monitoring seafloor litter on the continental shelf, but can have severe negative impacts on the environment. Here we evaluate the potential of an ongoing underwater television survey (UWTV) to also collect litter density data, and develop model-based indices of litter densities integrating coastal and offshore trawl survey data using geostatistical models. Based on our case study along the Swedish west coast, we find that UWTV in its current format may be limited as an alternative to trawling in areas with relatively low densities. There are also clear spatial trends in litter, with the highest densities in near-shores areas currently only included in the national monitoring program. Our results illustrate the potential of combining data, but also the importance of careful sampling designing for marine litter monitoring.
Copyright: © 2025 Norén et al. This is an open access article distributed under the terms of the Creative Commons Attribution License, which permits unrestricted use, distribution, and reproduction in any medium, provided the original author and source are credited.
Conflict of interest statement
The authors have declared that no competing interests exist.
Figures


Similar articles
-
Cost-effectiveness of using prognostic information to select women with breast cancer for adjuvant systemic therapy.Health Technol Assess. 2006 Sep;10(34):iii-iv, ix-xi, 1-204. doi: 10.3310/hta10340. Health Technol Assess. 2006. PMID: 16959170
-
Antidepressants for pain management in adults with chronic pain: a network meta-analysis.Health Technol Assess. 2024 Oct;28(62):1-155. doi: 10.3310/MKRT2948. Health Technol Assess. 2024. PMID: 39367772 Free PMC article.
-
Interventions to reduce harm from continued tobacco use.Cochrane Database Syst Rev. 2016 Oct 13;10(10):CD005231. doi: 10.1002/14651858.CD005231.pub3. Cochrane Database Syst Rev. 2016. PMID: 27734465 Free PMC article.
-
Indoor residual spraying for preventing malaria in communities using insecticide-treated nets.Cochrane Database Syst Rev. 2022 Jan 17;1(1):CD012688. doi: 10.1002/14651858.CD012688.pub3. Cochrane Database Syst Rev. 2022. PMID: 35038163 Free PMC article.
-
Nivolumab for adults with Hodgkin's lymphoma (a rapid review using the software RobotReviewer).Cochrane Database Syst Rev. 2018 Jul 12;7(7):CD012556. doi: 10.1002/14651858.CD012556.pub2. Cochrane Database Syst Rev. 2018. PMID: 30001476 Free PMC article.
References
-
- UNEP/GPA. Manila declaration on furthering the implementation of the global programme of action for the protection of the marine environment from land-based activities. 2012.
-
- Râpă M, Cârstea EM, Șăulean AA, Popa CL, Matei E, Predescu AM, et al. An overview of the current trends in marine plastic litter management for a sustainable development. Recycling. 2024;9(2):30. doi: 10.3390/recycling9020030 - DOI
MeSH terms
LinkOut - more resources
Full Text Sources

