. 2025 Jun 27;11(26):eadv0311.
doi: 10.1126/sciadv.adv0311. Epub 2025 Jun 27.

Automorphy as a self-organizing DPP-dependent process that translates patterns into mechanical programs during Drosophila embryogenesis

Affiliations

Automorphy as a self-organizing DPP-dependent process that translates patterns into mechanical programs during Drosophila embryogenesis

Baptiste Tesson et al. Sci Adv. .

Abstract

Morphogens provide developing tissues with positional information to ensure coherent morphogenesis. Bone morphogenetic proteins (BMPs) initially form a gradient to pattern the dorsal domains of the Drosophila embryo. Here, we show that the BMP homolog decapentaplegic (DPP) endows dorsal domains with specific mechanical programs to organize morphogenesis. These domains self-organize using high local DPP activities, a process we call automorphy. Automorphy is key to inducing specific morphological changes while being faithful to the initial positional information. The BMP morphogen therefore uses a series of automorphic events to translate each position into physical potentials that later produce a contractile amnioserosa and a dorsal epidermis displaying plasticity. Plasticity allows cell elongation in wild-type embryos, and perturbations of cellular patterns reveal its crucial role in adapting to mechanical constraints. We propose that gradient formation and automorphy constitute complementary processes that allow BMPs to act as a morphogen in the Drosophila embryo.


Figures

Fig. 1.
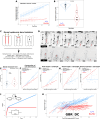
Fig. 1.. DPP signaling through development contributes later to dorsal closure.
(A) Embryos expressing the Dad:GFP::NLS reporter in control (a), jra (b), or tkv (c) genetic background. (B) Dad:GFP::NLS reporter expression profile in the first abdominal segment of the embryos shown in (A) in arbitrary units (A.U.). (C) Phosphorylated Mad (pMad) stainings of stages 9 and 10 (a), stage 11 (b), or stage 13 (c) control embryos. (D) pMad stainings of stages 9 and 10 (a), stage 11 (b), or stage 13 (c) tkv mutant embryos. (E) Time-lapse imaging of shg::mKate2 embryos expressing the UAS_APC2::GFP reporter under the control of the pnr-Gal4 driver. (F) pMad staining of a stage 12 UAS-Dad pnr-Gal4 UAS-APC2::GFP embryo. (G) Schematics of the experimental procedure to selectively impair DPP signaling from different stages of development. Embryo schematics inspired from the Atlas of Drosophila Development (67). (H to K) Time-lapse imaging of embryos expressing the UAS_APC2::GFP reporter under the control of the pnr-Gal4 driver in a control (H), UAS-Dad (I), jra (J), or tkv (K) background, from 0 to 240 min post–dorsal-closure onset for control and UAS-Dad embryos [(H), c and (I), c] or 160 min post–DC onset for jra and tkv embryos [(J), c and (K), c]. [(H) d, (I) d, (J) d, and (K) d] display close-ups from the end of closure (240 min) for control and Dad overexpression and midclosure (120 min) for jra and tkv mutants. Please note that by 120 min, the tkv embryo is already undergoing evisceration. (L) Close-up images of the leading edges of control (a), jra (b), and tkv (c) mutants in the Jupiter::GFP background. Red arrowheads indicate detachment between the amnioserosa and the dorsal epidermis, and green arrowheads indicate ipsilateral fusions of the dorsal epidermis.
Fig. 2.
Fig. 2.. Amnioserosa contraction does not rely anymore on DPP signaling at the time of dorsal closure.
(A) Maximum projection of time-lapse imaging of shg::GFP (H) and (H′) tkv4/tkv4; shg::GFP stage 14 embryos showing results of leading-edge laser ablation. (B) Comparison of the initial recoil velocity between shg::GFP (n = 30) and tkv4/tkv4; shg::GFP (n = 22) embryos among three technical replicates by Wilcoxon rank sum test. (C) Comparison of the characteristic time of retraction after ablation estimated by exponential fit between shg::GFP (n = 13) and tkv4/tkv4; shg::GFP (n = 11) embryos by Wilcoxon rank sum test. n.s., not significant. (D) Mean cell elongation of ablated cells as a function of initial recoil for shg::GFP (n = 30) and tkv4/tkv4; shg::GFP (n = 22). Linear regressions performed for each genotype are displayed as lines. (E) Time-lapse imaging of shg::GFP embryos in a control or tkv4 genetic background. (F) Quantification of the amnioserosa short axis in function of time from the onset of DC for shg::GFP (n = 31), tkv4/+; shg::GFP (n = 35), and tkv4/tkv4; shg::GFP (n = 36) embryos among three technical replicates. LOESS (locally estimated scatterplot smoothing) regressions are performed for each embryo and displayed as lines. Mean LOESS regressions for each genotype are displayed as bold lines. Data are normalized by the maximum value reached by each embryo. (G) Comparison of the maximum short axis closure speed extracted from a five-parameter logistic regression fit for each amnioserosa closure of shg::GFP (n = 31), tkv4/+; shg::GFP (n = 35), and tkv4/tkv4; shg::GFP (n = 36) embryos. Comparison using analysis of variance (ANOVA) followed by Tukey post hoc tests. (H) Time-lapse imaging of CAAX::GFP embryos in a control, tkv, spo, or tkv spo background. Extruding hindgut in the tkv spo double mutant is indicated by a red arrow. *P < 0.05, ***P < 0.001, and ****P < 0.0001.
Fig. 3.
Fig. 3.. Early DPP controls dorsal epidermis elongation by inducing an elastic-to-plastic phase transition.
(A) Elongation quantification in the A1 segment over time for shg::GFP (n = 9) and tkv4 shg GFP (n = 7). Simple lines: LOESS regression per embryo. Bold lines: Linear regression per genotype. (B) Elongation speed in shg::GFP (n = 9) and tkv4 shg GFP (n = 7) extracted by linear regression per embryo (adjusted R-squared: 0.9352). Comparison established with Wilcoxon test. (C) Experimental strategy for viscoelastic and viscoplastic property evaluation. Red lines indicate ablations. (D) Maximum projection of shg::mKate2 and tkv4 shg::mKate2 following (C). Red indicates segmented cells. (E) Retraction time of 12 stripes from shg::mKate2 and 5 stripes from tkv4 shg::mKate2. Comparison established with Wilcoxon rank sum test. (F to I) Cell properties before and after retraction. A total of 33 cells from eight controls among two technical replicates and 30 tkv cells from seven stripes among three technical replicates. Comparison: Analysis of covariance (ANCOVA)’s F tests. Lines: Linear regression per genotype. (F) Cell elongation after retraction versus cell elongation before ablation. (G) Rest length of cells after retraction versus before ablation. (H) Retraction length of cells versus length before ablation. (I) Recoil over length before ablation as a function of length before ablation. (J) Simulation of elongation under constant force: Viscoelastic (red) and viscoplastic materials (blue). Viscoelastic characteristic time is estimated from (H) (5 min), maximal viscoelastic elongation from (J) (40 μm), and plastic elongation rate (speed at which new elastic units are added) from (B) (0.2 μm/min). (K) Elongation of abdominal segments of shg::GFP; Jupiter::GFP (n = 12 segments, six embryos) and tkv4 shg::GFP; Jupiter::GFP (n = 12 segments, four embryos) over time just after germ-band retraction (GBR). Lines: LOESS regression in each abdominal segment. ***P < 0.001 and ****P < 0.0001.
Fig. 4.
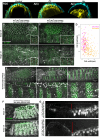
Fig. 4.. DPP-controlled cell plasticity allows adaptable and robust morphogenesis.
(A) Transverse optical sections of time-lapse imaging of CAAX::GFP (a), jra/jra; CAAX::GFP (b), and tkv4/tkv4; CAAX::GFP (c) embryos. Cyan channels are stage 13 and yellow channels are stage 14 of the same embryo to appreciate changes in morphogenesis. Arrows of the corresponding color indicate the dorsal epidermis/amnioserosa junction. (B) Maximum of time-lapse imaging of tkv4 shg::mKate2/tkv4; pnr-Gal4/UAS-tkv::GFP from the onset of dorsal closure (stage 14) to its completion (stage 15) (n = 17 completion of closure, four technical replicates). Close-ups (bottom right) show the main orientation of cell elongation (red arrows). (C) Maximum projection of time-lapse imaging of tkv4 shg::mKate2/tkv4; prd-Gal4/UAS-tkv::GFP from the onset of closure (stage 14) to its completion (stage 15) (n = 7 completion of closure including 3 with anterior-open phenotype, two technical replicates). Close-ups (bottom right) show the main orientation of cell elongation (red arrows). (D) Quantification of cell long and short axes from ellipsoid fit after manual segmentation at closure completion in shg::mKate2 tkv4/tkv4; pnr-Gal4/UAS-tkv::GFP embryos (107 cells from five embryos) and shg::mKate2 tkv4/tkv4; prd-Gal4/UAS-tkv::GFP embryos (206 cells from four embryos). (E) Maximum projection of time-lapse imaging of tkv4 shg::mKate2/tkv4; hh-Gal4/UAS-tkv::GFP from the onset of closure to completion (n = 7 completion of DC and n = 10 dorsal-open phenotype, four technical replicates). (E) Associated close-ups on leading-edge cells. (F) Maximum of SD projection of time-lapse imaging of tkv4 shg::mKate2/tkv4; Ubx-Gal4/UAS-tkv::GFP UAS-RFP::NLS from the onset of closure (n = 18 completion of DC with anterior-open phenotype, four technical replicates). (G) Sagittal slices at closure completion associated with (F). Red bars indicate the distance between the epidermis at the boundary of the Ubx domain and the vitelline membrane seen by autofluorescence.
Fig. 5.
Fig. 5.. Automorphy translates DPP patterning into morphogenesis.
(A) Timeline of DPP-mediated patterning and automorphic phases that leads to (B) a mechanical system that allows robust morphogenesis during dorsal closure. Cyan intensity indicates the strength of BMP/DPP signaling, and the other colors refer to the different automorphic phases (A) and the localization of the target tissues during morphogenesis (B).

Similar articles

References

    1. Turing A. M., The chemical basis of morphogenesis. Philos. Trans. R. Soc. Lond. Ser. B Biol. Sci. 237, doi.org/10.1098/rstb.1952.0012 (1952). - PMC - PubMed
    1. Wolpert L., Positional information and the spatial pattern of cellular differentiation. J. Theor. Biol. 25, 1–47 (1969). - PubMed
    1. Briscoe J., Sussel L., Serup P., Hartigan-O’Connor D., Jessell T. M., Rubenstein J. L. R., Ericson J., Homeobox gene Nkx2.2 and specification of neuronal identity by graded Sonic hedgehog signalling. Nature 398, 622–627 (1999). - PubMed
    1. Jessell T. M., Neuronal specification in the spinal cord: Inductive signals and transcriptional codes. Nat. Rev. Genet. 1, 20–29 (2000). - PubMed
    1. Kutejova E., Sasai N., Shah A., Gouti M., Briscoe J., Neural progenitors adopt specific identities by directly repressing all alternative progenitor transcriptional programs. Dev. Cell 36, 639–653 (2016). - PMC - PubMed

MeSH terms

Substances

LinkOut - more resources