. 2025 Jun 27;11(26):eadw6814.
doi: 10.1126/sciadv.adw6814. Epub 2025 Jun 27.

Sequestration of ribosome biogenesis factors in HSV-1 nuclear aggregates revealed by spatially resolved thermal profiling

Affiliations

Sequestration of ribosome biogenesis factors in HSV-1 nuclear aggregates revealed by spatially resolved thermal profiling

Peter J Metzger et al. Sci Adv. .

Abstract

Viruses exploit host cell reliance on compartmentalization to facilitate their replication. Herpes simplex virus type 1 (HSV-1) modulates the subcellular localization of host proteins to suppress immune activation, license viral gene expression, and achieve translational shutoff. To spatially resolve dynamic protein-protein interaction (PPI) networks during infection with an immunostimulatory HSV-1 strain, we integrated nuclear/cytoplasmic fractionation with thermal proximity coaggregation analysis (N/C-TPCA). The resulting expanded depth and spatial resolution of PPIs charted compartment-specific assemblies of protein complexes throughout infection. We find that a broader suite of host chaperones than previously anticipated exhibits nuclear recruitment to form condensates known as virus-induced chaperone-enriched (VICE) domains. Monitoring protein and RNA constituents and ribosome activity, we establish that VICE domains sequester ribosome biogenesis factors from ribosomal RNA, accompanying a cell-wide defect in ribosome supply. These findings highlight infection-driven VICE domains as nodes of translational remodeling and demonstrate the utility of N/C-TPCA to study dynamic biological contexts.


Figures
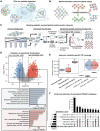
Fig. 1.
Fig. 1.. Introducing and evaluating a subcellular fractionation TPCA-based method for studying spatially resolved global PPI networks.
(A) In cells, PPIs are spatiotemporally regulated. (B) Fractionating before performing global assays allows protein interactions to be studied with spatial specificity. (C) To couple nuclear-cytoplasmic fractionation with TPCA to probe fraction-specific global PPI networks, the cells are first subjected to thermal denaturation, followed by nuclear-cytoplasmic fractionation, lysis, and MS analysis. Tapioca (27) is used to predict PPIs from N/C-TPCA data. (D) Volcano plots of N/C-TPCA data represent the relative cytoplasmic and nuclear abundance of the 37°C sample for a given protein. Proteins with enrichment in the cytoplasmic fraction [log2(fold change) ≤ −1] are colored blue, and nuclear fraction [log2(fold change) ≥1, P value ≤0.05] are colored red. Vertical dotted lines represent fold change cutoffs, and horizontal dotted lines represent the P value cutoff. Below the volcano plot, the top eight (ranked by P value) GO subcellular compartment terms are shown for the cytoplasmic and nuclear fractions. GO term enrichment was performed using Enrichr (78). (E) The number of previously known PPIs [from BioGrid (41), REACTOME (43), and Mint (42)] that were predicted by Tapioca in the cytoplasmic, nuclear, and combined fractions, as well as in whole-cell samples from the mock conditions of three previous studies (–27). In boxplots, boxes show median, 25th, and 75th percentile values, with the line within the box representing the median value, and whiskers represent ±1.5 interquartile range. A Venn diagram compares the most consistently detected known PPIs (detected in two or more replicates). (F) UpSet plot comparing CORUM complexes (39) assemblies predicted by Tapioca in cytoplasmic, nuclear, and both fractions compared to whole-cell extracts from three previous studies (–27). For all experiments depicted, n = 3 biological replicates for each temperature.
Fig. 2.
Fig. 2.. N/C-TPCA enables detection of spatially specific CORUM complex assembly and melting curve behavior.
A heatmap of the Tapioca scores of CORUM complexes (39) in the cytoplasmic and nuclear fractions is shown. The table of CORUM complexes and their scores can be found in the Supplementary data. Examples of melting curve behavior, Tapioca scores, and relative abundance were generated for 10 of these complexes. For these vignettes, a synthetic whole cell (Syn. Whole, S.W.) fraction was created by summing the reference normalized cytoplasmic (Cyto., C.) and nuclear (Nuc., N.) melting curves before further normalization. In the melting curve plots, each line represents the replicate-averaged melting profile for a single protein within the CORUM complex. CORUM complexes were predicted to be assembled if they achieved an average score greater than or equal to 0.6. This cutoff is shown as a horizontal dotted line in the boxplots. In boxplots, boxes show median, 25th, and 75th percentile values, with the line within the box representing the median value, and whiskers represent ±1.5 interquartile range. The reference normalized value at the 37°C for each protein within the complex was used to generate the relative abundance violin plots. For violin plots, the white dot represents the median, the thick black bar represents the ±1.5 interquartile range, and the thin gray line represents the total range, excluding outliers. For all experiments depicted, n = 3 biological replicates for each temperature.
Fig. 3.
Fig. 3.. Leveraging N/C-TPCA to characterize the spatiotemporal regulation of global PPI networks during immunostimulatory HSV-1 infection.
(A) Schematic representation of HSV-1 RF infection N/C-TPCA experiment. (B) Nuclear and cytoplasmic relative abundance of ICP0 host targets throughout the infection time course. (C) PCA on ICP0 host target interactome across all time points. Interactors were included if they achieved a Tapioca score of at least 0.3 with at least one target. K-means clustering (K = 3, for 0, 8, and 15 hpi, or K = 4 for 3 hpi) was used to cluster the ICP0 target proteins. The first and second PCA dimensions and clusters (dotted outline) are shown. (D) Temporal GO term enrichment [using HumanBase (77)] of host interactors of viral proteins in the nuclear and cytoplasmic fractions. (E) Vignettes of viral protein relative abundance, number of PPIs, and GO term enrichment of all host interactors. In PPIs plot, the line represents the number of PPIs with a minimum median Tapioca score of 0.7. Top 5 GO terms [using Enrichr (78)] were ranked by P value, are shown. (F) Protein nuclear/cytoplasmic ratio at different time points of infection (3, 8, and 15 hpi) compared to mock (0 hpi). Each marker represents the average abundance across three replicates for a single protein and is colored by the fraction in which it is predicted to interact with a viral protein. Cutoffs, P value (0.05) and fold change, (±1) are shown as dashed lines. (G) Temporal dynamics of CORUM complex (39) abundances and Tapioca scores. Complexes are considered assembled if they pass the cutoff score (0.6). For all line plots, the solid line represents the median value and the shaded region is the 95% confidence interval. For all experiments depicted, n = 3 biological replicates for each temperature and infection time point.
Fig. 4.
Fig. 4.. Chaperone proteins exhibit dynamic recruitment to the nucleus and engage in specific nuclear interaction networks during HSV-1 infection.
(A) The temporal dynamics of chaperone protein relative abundance ratios (nuclear/cytoplasmic) relative to their ratio at 0 hpi. (B) Network of interacting chaperone and viral proteins. Proteins are connected if they are predicted to interact with one another at any time point (0 to 15 hpi). Proteins are colored as belonging to host (blue) or virus (orange). (C) HFFs were infected with ICP0-RF HSV-1 (MOI 5) and collected at 8 hpi, followed by immunofluorescent staining against HSC70, PML, and ICP27. Scale bar, 5 μm. (D) HFFs were mock infected or infected with WT HSV-1 (MOI 5) and collected at 3, 6, or 9 hpi. One hour before collection, the cells were depleted of l-methionine for 30 min followed by incubation with L-HPG for 30 min to label nascent proteins, after which sequential click-based fluorescent conjugation and immunofluorescent staining were performed. (E) Pie charts showing the number of proteins associated with a given GO term at different time points. GO term enrichment was performed using HumanBase (77) on the set of host proteins predicted to interact in the nucleus with at least three chaperone proteins present in the network shown in Fig. 4B. These GO terms were then ranked by the maximum number of proteins associated with a given term across all time points of infection. The top 50 GO terms were manually clustered, and the total number of proteins belonging to each cluster was used to generate pie charts.
Fig. 5.
Fig. 5.. VICE domains enrich nucleolar ribosome biogenesis factors while excluding nascent RNAs.
(A) Networks in which the center protein is a host protein that interacts connected to its specific chaperone and viral interactors. Each network is shown as a separate entity, and chaperone-chaperone, chaperone-virus, and virus-virus edged are excluded for simplicity. (B and C) HFFs stably expressing the indicated HaloTag fusion protein were mock infected or infected with WT HSV-1 (MOI 5) and collected at 8 hpi, followed by immunofluorescent staining against HSC70 and ICP4. Scale bar, 5 μm. (D and E) HFFs were mock infected (left) or infected with WT HSV-1 (MOI 5) (right). At 6 hpi, cytoplasmic (D) and nuclear (E) extracts were subjected to sucrose gradient fractionation. (F) HFF cells were mock infected or infected with WT HSV-1 and collected at 6 hpi. Thirty minutes before collection, 5-ethynyl uridine was added to the media to label nascent RNA, after which sequential click-based fluorescent conjugation and immunofluorescent staining was performed against HSC70 and ICP4. Scale bar, 10 μm. (G) RNA FISH probes were designed to span splicing junctions absent in mature transcripts. HFFs were mock infected or infected with WT HSV-1 (MOI 5) and collected at 8 hpi, after which sequential fluorescent in situ hybridization and standard immunofluorescence were performed against the indicated probe and HSC70. Scale bar, 5 μm.
Fig. 6.
Fig. 6.. VICE domains recruit both preexisting and newly synthesized ribosomal proteins upon infection.
(A) HFFs stably expressing the indicated HaloTag fusion protein were mock infected or infected with WT HSV-1 (MOI 5) and collected at 8 hpi, followed by immunofluorescent staining against HSC70 and ICP4. Scale bar, 5 μm. (B) Schematic workflow for labeling different molecular populations according to age. Preexisting proteins were specifically labeled by addition of fluorescent HaloTag ligand to the culture media for 30 min, followed by replacement with media containing a nonfluorescent ligand to block further fluorescent incorporation into newly translated populations. Inversely, nascent proteins were specifically labeled by first incubating cells with the nonfluorescent ligand to block fluorescent detection of preexisting populations followed by replacement with media containing fluorescent ligand, allowing only newly translated populations to be labeled. (C) HFFs stably expressing RPS6-HaloTag were incubated with fluorescent ligand to label nascent protein for either 120 or 30 min (left), from which nuclear-masked intensities of the ligand versus 4′,6-diamidino-2-phenylindole (DAPI) channels were used to validate time-dependence of fluorescent signal. Scale bar, 10 μm. (D) HFFs stably expressing an RPL3 HaloTag fusion construct were treated as described in (B) to differentially label extant and nascent protein populations and collected at 8 hpi, followed by standard immunofluorescent staining against HSC70 and ICP4. Scale bar, 5 μm. (E) HFFs were mock infected or infected with WT HSV-1 (MOI 5) and collected at 4 and 8 hpi, followed by immunofluorescent staining against HSC70 and 5.8S rRNA. Scale bar, 5 μm. (F) Proposed model describing how VICE domains contribute to HSV-1–driven disruption of ribosome biogenesis and translational balance.

Similar articles

References

    1. Monier K., Armas J. C., Etteldorf S., Ghazal P., Sullivan K. F., Annexation of the interchromosomal space during viral infection. Nat. Cell Biol. 2, 661–665 (2000). - PubMed
    1. Lewis H. C., Kelnhofer-Millevolte L. E., Brinkley M. R., Arbach H. E., Arnold E. A., Sanders S., Bosse J. B., Ramachandran S., Avgousti D. C., HSV-1 exploits host heterochromatin for nuclear egress. J. Cell Biol. 222, e202304106 (2023). - PMC - PubMed
    1. Maeda F., Arii J., Hirohata Y., Maruzuru Y., Koyanagi N., Kato A., Kawaguchi Y., Herpes simplex virus 1 UL34 protein regulates the global architecture of the endoplasmic reticulum in infected cells. J. Virol. 91, e00271–e00217 (2017). - PMC - PubMed
    1. Rodríguez M. C., Dybas J. M., Hughes J., Weitzman M. D., Boutell C., The HSV-1 ubiquitin ligase ICP0: Modifying the cellular proteome to promote infection. Virus Res. 285, 198015 (2020). - PMC - PubMed
    1. Chelbi-Alix M. K., de Thé H., Herpes virus induced proteasome-dependent degradation of the nuclear bodies-associated PML and Sp100 proteins. Oncogene 18, 935–941 (1999). - PubMed