. 2025 Jun 27;11(26):eadx3011.
doi: 10.1126/sciadv.adx3011. Epub 2025 Jun 27.

Large-scale experimental assessment of variant effects on the structure and function of the citrate transporter SLC13A5

Affiliations

Large-scale experimental assessment of variant effects on the structure and function of the citrate transporter SLC13A5

Wen-An Wang et al. Sci Adv. .

Abstract

Citrate is an essential metabolite playing critical roles in metabolism and as a neuromodulator during cellular differentiation and development. Mutations in the human citrate transporter SLC13A5, highly expressed in neurons, have been associated with a debilitating form of epileptic encephalopathy. In this study, we used deep mutational scanning to reveal the effect of 90% of all possible single missense variants on the structure and function of SLC13A5. Computational analyses and a detailed experimental validation of 38 variants revealed an accuracy of 86% and provided mechanistic interpretations for deleterious mutations, including the effect on protein stability, trafficking, and citrate transport. Analyses of blood citrate concentration from individuals enrolled in the UK Biobank study supported our analyses. The results illustrate an unbiased mutational landscape of the citrate transporter, illuminate mechanisms of pathogenicity, and offer a platform for the analysis of specific variants as well as opportunities for the future development of intervention strategies.


Figures
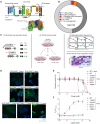
Fig. 1.
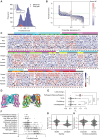
Fig. 1.. Premise and experimental setup for the deep mutational scan (DMS) of hSLC13A5.
(A) Topology of the hSLC13A5 monomer (top) and the structure model of the hSLC13A5 dimer (bottom); the colors of the domains from the topology are mapped onto the structure model. Depictions are based on the cryo–electron microscopy (cryo-EM) structure of SLC13A5 [Protein Data Bank (PDB): 7JSK]. (B) Pie chart depicting the classification of hSLC13A5 variants from ClinVar and gnomAD. Most of the 338 missense and stop gain variants are VUS and uncategorized. (C) A schematic illustrating the deep mutational scanning (DMS) experiment, which consists of four steps: (1) generate a barcoded site-saturation library of SLC13A5; (2) assess the functional impact of each variant in human embryonic kidney (HEK) 293T cells with the citrate toxicity assay; (3) use next-generation sequencing to measure the frequency of each variant before and after selection pressure at different time points throughout the assay; and (4) derive a functional score based on the regression slope for each variant. (D) Representative immunofluorescent images of HEK293T cells recombined and either uninduced (−dox) or induced (+dox) for the expression of wild-type (WT) and variant (T142M, T227M, R333*, W341*, and T468N) SLC13A5. SLC13A5 was detected with Strep-TactinXT targeting the C-terminal Strep II tag. The displayed scale bar is 50 μm in length. DAPI, 4′,6-diamidino-2-phenylindole. (E) Cell toxicity assay of HEK293T cells generated in (D). Cells were treated with increasing concentrations (0, 0.01, 0.05, 0.2, 0.78, 3.125, 12.5, and 50 mM) of citrate for 48 hours and assessed for cell viability. (F) The Citron1-mCherry biosensor was introduced into the HEK293T cells generated in (D). Intracellular citrate levels were determined with measured fluorescence 10 min after treating cells with increasing concentrations (0, 0.01, 0.05, 0.2, 0.78, 3.125, and 12.5 mM) of citrate. All points and error bars represent means ± SD over four to six biological experiments.
Fig. 2.
Fig. 2.. Results and assessment of the DMS of hSLC13A5.
(A) Histogram of the DMS functional scores displaying a bimodal distribution of neutral (>−0.5) and deleterious (<−0.5) populations of missense (blue) and nonsense/stop-gain (red) variants. (B) A DMS functional score versus probability deleterious (Pd) graph. SE, standard error. (C) SLC13A5 DMS heatmap of functional scores: red (<−0.5), gray (−0.5), blue (>−0.5), black (WT amino acids), and white (missing scores). Amino acids on the y axis are categorized on the basis of different properties, listed in order: negatively (−) charged (E and D), positively (+) charged (H, R, and K), polar (Q, N, P, C, T, and S), aromatic (W, Y, and F), aliphatic (I, M, L, V, A, and G), and stop codons (X). Domain properties (corresponding to D) are indicated along the top of the heatmap. (D) The structure models of the hSLC13A5 dimer highlighting the scaffold (cyan) and transport (violet) domains (left) and the transmembrane domains (right). Depictions are based on the cryo-EM structure of SLC13A5 (PDB: 7JSK). (E) Distribution of Pd of the 338 missense and stop-gain variants from ClinVar and gnomAD. An ordinary one-way analysis of variance (ANOVA) was performed. ****P < 0.0001; n.s., nonsignificant. (F) The DMS functional score distributions of variants that affect the structural function of SLC13A5. The DMS functional scores are plotted for specific variants that were predicted to disrupt conformational change, folding/dimerization, interaction between H4c, H6b, and TM7, and substrate binding. The DMS functional scores are plotted out for all possible variants at residues predicted for interactions with carboxylic moieties, Na+ coordination, aromatic side chains, hydrogen bonds, Ser-Asn-Thr (SNT) sequence, and general interactions. (G) DMS functional score distributions by a variant stability classification based on computational predictions. (H) DMS functional score distributions by a surface accessibility classification of variants.
Fig. 3.
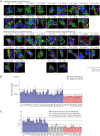
Fig. 3.. Experimental assessment of 38 hSLC13A5 variants.
(A) Representative immunofluorescence images of HEK293T cells expressing SLC13A5WT and SLC13A5V1-38 and stained with Strep-TactinXT (SLC13A5), anti-SLC1A5 (PM) antibody, and DAPI (nuclear). Representative of 15 images for WT and variants. The displayed scale bars are 25 μm in length. Images are grouped on the basis of staining and citrate transport function. (B) Staining intensity of SLC13A5 in the region of the PM marker marked by anti-SLC1A5 antibody. The range of positive PM staining is marked defined by two SDs from the mean of WT (dotted lines). Columns and error bars represent mean and SD of PM staining intensity per cell across 15 images. (C) Citrate transport assay of HEK293T cells expressing SLC13A5WT and SLC13A5V1-38 measured with the Citron1-mCherry biosensor. Cells were exposed to 0.8 mM citrate for 10 min, and the FGFP/FmCherry was recorded. The functional FGFP/FmCherry range is defined as one SD from the mean of WT (dotted lines). Columns and error bars represent mean and SD of three biological experiments; a total of 164 measurements for WT and 25 measurements per variants were made.
Fig. 4.
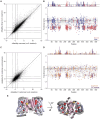
Fig. 4.. Computational assessment of variant effect on the thermodynamic stability of SLC13A5.
(A) Distribution of variant effects on the changes in thermodynamic stability (∆∆G, kcal/mol) of the monomer versus dimer. Variants were filtered to exclude values with a SD >1.5 (dotted lines). (B) The upper fifth percentile contains 540 monomer destabilizing mutations (red) and 602 dimer destabilizing mutations (blue). These are represented as a frequency plot (top) and highlighted on the DMS functional scores (bottom) over the length of the protein. (C) Distribution of variant effects on the changes in thermodynamic stability (∆∆G, kcal/mol) of the IF versus the OF conformers. Variants were filtered to exclude values with a SD > 1.5 (dotted lines). (D) The upper fifth percentile contains 229 IF conformer destabilizing mutations (orange) and 228 OF conformer destabilizing mutations (purple). These are represented as a frequency plot (top) and highlighted on the DMS functional scores (bottom) over the length of the protein. (E) The structure model of the hSLC13A5 dimer depicting the 10 validated variants—V9 (T145K), V10 (T145M), V11 (M147I), V14 (S271N), V17 (A251V), V22 (V359M), V32 (L471S), V33 (P474L), V35 (L492P), and V37 (P558L)—is colored red and located in the transport domains surrounding the Na+ and citrate binding pockets. V22 (V359M) in yellow may interfere with dimer formation. Front view (left) and top view (right).
Fig. 5.
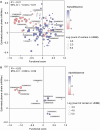
Fig. 5.. Human genetics structure-activity relationship (HGSAR) analysis for 201 naturally occurring hSLC13A5 variants.
Relationships between the DMS functional score and the association estimate of the factor genotype (minor allele) for plasma citrate (millimolar) measured in UKBB participants were evaluated per group of variant carriers. Size of data points equals the number of variant carriers in UKBB; the P value provides the significance level of the coefficient for parameter genotype for the model fit of each variant group [null hypothesis, H0: β1 = 0 (genotype does not influence citrate levels); alternative hypothesis, HA: β1 ≠ 0 (genotype does influence citrate levels)]. Variants were annotated with the AlphaMissense variant effect prediction score ranging from benign (blue) over ambiguous (white) to pathogenic (red). The data for all 201 variants are depicted in (A) and the data filtered for minor allele counts larger than 25 are depicted in (B).

Similar articles

References

    1. Tannahill G. M., Curtis A. M., Adamik J., Palsson-McDermott E. M., McGettrick A. F., Goel G., Frezza C., Bernard N. J., Kelly B., Foley N. H., Zheng L., Gardet A., Tong Z., Jany S. S., Corr S. C., Haneklaus M., Caffrey B. E., Pierce K., Walmsley S., Beasley F. C., Cummins E., Nizet V., Whyte M., Taylor C. T., Lin H., Masters S. L., Gottlieb E., Kelly V. P., Clish C., Auron P. E., Xavier R. J., O’Neill L. A., Succinate is an inflammatory signal that induces IL-1β through HIF-1α. Nature 496, 238–242 (2013). - PMC - PubMed
    1. Carey B. W., Finley L. W., Cross J. R., Allis C. D., Thompson C. B., Intracellular α-ketoglutarate maintains the pluripotency of embryonic stem cells. Nature 518, 413–416 (2015). - PMC - PubMed
    1. Wellen K. E., Hatzivassiliou G., Sachdeva U. M., Bui T. V., Cross J. R., Thompson C. B., ATP-citrate lyase links cellular metabolism to histone acetylation. Science 324, 1076–1080 (2009). - PMC - PubMed
    1. Petroff O. A., Yu R. K., Ogino T., High-resolution proton magnetic resonance analysis of human cerebrospinal fluid. J. Neurochem. 47, 1270–1276 (1986). - PubMed
    1. D. T. Monaghan, D. E. Jane, “Pharmacology of NMDA receptors” in Biology of the NMDA Receptor, A. M. Van Dongen, Ed. (Taylor & Francis, 2009), pp. 257–282. - PubMed

LinkOut - more resources