. 2025 Jun 27;11(26):eadx2050.
doi: 10.1126/sciadv.adx2050. Epub 2025 Jun 27.

Metabolic regulation of visual acuity

Affiliations

Metabolic regulation of visual acuity

Douglas Emery et al. Sci Adv. .

Abstract

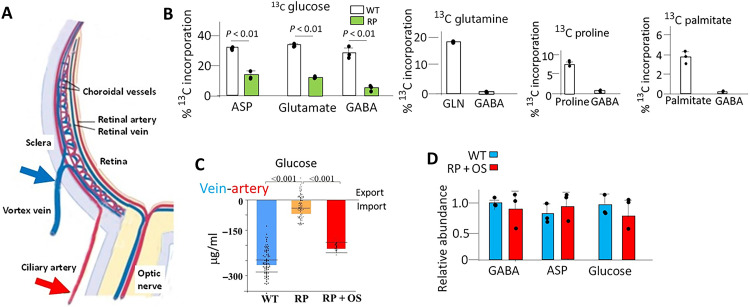
Photoreceptors signal ON and OFF pathways via a synapse with bipolar cells that are transmitted to retinal ganglion cells (RGCs) for luminance and contrast detection. Retinal neurons metabolize glucose whose transport is mediated by photoreceptor contact with the adjacent retinal pigment epithelium (RPE). Rod loss in retinitis pigmentosa (RP) reduces RPE contact, diminishing glucose transport. We show diminished glucose leads to light hyperresponsiveness driven by deregulated ON cone bipolar signaling. Transmission of this constitutive signal to RGCs causes ON > OFF signaling imbalance and failure to detect luminance and contrast changes. Our results suggest that the aspartate-malate shuttle in GABAergic amacrine cells metabolizes glucose to γ-aminobutyric acid (GABA), which in turn regulates the ON cone bipolar signal. GABAA receptor agonists such as Ativan are a widely prescribed first-line therapy for seizures initiated by low brain GABA, and we show that Ativan restores ON cone bipolar cell regulation in RP where retinal GABA is diminished, reestablishing luminance and contrast detection.


Figures

Fig. 1.
Fig. 1.. The cone ON bipolar cell signal becomes hyperresponsive to light in RP pigs.
(A) Models showing the initial loss of rod OSs and rod cell bodies early in RP pigs, extending to ~P60. After rods are lost, cones displaying OSs persist in intermediate RP extending to ~P150, and then in the later stage, RP cones persist but OSs are lost and photopic ERG is diminished (–18). This stage is stable in the pigs for at least 4 years (15, 17, 18). ONL, outer nuclear layer; IS, photoreceptor inner segment. (B) ffERG flash duration series in WT and intermediate RP pigs at P120 under photopic conditions, 75 cd·s/m2 flash on a 30 cd·s/m2 background. a-, b-, and d-waves are labeled. (C) Quantification of b-wave amplitude during and after a 1-ms flash. (D) b-wave amplitude during a 1000-ms flash. n = 4. (E) ffERG shows diminished suppression of the bipolar cell b-wave in RP pigs at P120 during a 250-ms flash. Intravitreal injection of APB, or sham control injection, was used to inhibit the ON bipolar signal and isolate the OFF pathway (Materials and Methods). The ON-driven b-wave is eliminated, and similar OFF signals are evident in WT and RP pigs with an OFF-initiated d-wave evident at light offset. See quantification of the OFF bipolar cell d-wave in WT and RP pigs in Fig. 4C below. Error bars indicate the standard error of the mean. Significance was calculated by Student’s t test.
Fig. 2.
Fig. 2.. Increasing luminance or repeated brief flashes lead to deregulated ON bipolar cell signaling in RP, and a GABAA receptor agonist restores regulation.
(A) ffERG showing the effect of increasing luminance on the bipolar response following a 1-ms flash in RP pigs at P120. (B to G) The amplitude of the ON bipolar cell signal decreases, and signal duration increases with the number of trials in a photopic flicker protocol in RP compared to WT pigs at P120 (Materials and Methods). Intravenous treatment with lorazepam (Materials and Methods) for 2 hours (treated) or sham control (untreated) significantly restored signal amplitude and duration toward WT. (H) The amplitude and duration of the signal in (B) to (F) were quantified. n = 3. Points show repeats at the indicated trial number. Bars indicate the standard error of the mean. Significance was calculated by Student’s t test.
Fig. 3.
Fig. 3.. GABA is diminished along with glucose in the RP retina, and cone ON bipolar cells express RNAs for GABA receptors.
(A) MS showing that the level of GABA, but not glycine, is diminished in the RP pig retina versus WT at P120 in parallel with glucose. n = 3. Error bars indicate the standard error of the mean. Significance was calculated by Student’s t test. (B and C) Immunostaining for GABA shows reduced levels in the RP pig retina at P120, consistent with MS levels in (A). GCL, ganglion cell layer; INL, internuclear layer; ONL, outer nuclear layer. Note with the loss of rods in RP, the ONL is reduced to one to two rows of cones. Scale bars are 50 μm. Higher-power views are shown in insets. (D) scRNASeq analysis of human retina cells shows that ON cone bipolar cells are enriched for GABA receptor RNAs compared to OFF bipolar cells. In the dot plots, the color shows the RNA expression level and the diameter shows the percentage of cells expressing. Cone OFF bipolar cells are marked by GRIK1 RNA, rod bipolar cells by PRKCA and GRM6 RNAs, and cone ON bipolar cells by GRM6 RNA.
Fig. 4.
Fig. 4.. Failure to suppress the initial cone ON bipolar signal in RP pigs causes a positive PERG reflecting the loss of contrast sensitivity, and a GABAA receptor agonist restores regulation of ON cone pathway signaling and contrast sensitivity.
(A) Intravitreal injection of bicuculline, or sham injection control, in WT pigs (Materials and Methods) was used to inhibit the GABAA receptor. ffERG showing a 250-ms flash at 75 cd·s/m2 on a 30 cd·s/m2 background as in Fig. 1D. (B) Intravenous injection of lorazepam, or a sham injection control (Materials and Methods), was used as a GABAA receptor agonist, and ffERG during a 250-ms flash as in (A) was compared in WT, untreated RP, and RP pigs 2 hours after lorazepam injection (treated). Arrows indicate points where amplitude was compared in (C). (C) Quantification of amplitudes from (B). n = 4. (D and E) PERG comparing WT and RP littermates at P120 treated for 30 min and 2 hours with 5 mg of lorazepam (treated) or sham injection controls (untreated). P50 and N95 peak locations are noted. Amplitudes at 50 and 95 ms in (D) are quantified in WT and RP pigs in (E). (F and G) PERG showing the effect of blocking the ON bipolar pathway with APB in WT and RP littermates at P120. See Fig. 1E). (H and I) Effect of diminishing contrast on PERG in WT and RP littermates at P60. Where indicated, pigs were treated with 5 mg of lorazepam for 2 hours (treated) or sham injection control. n = 4. Error bars are the standard error of the mean. Significance was calculated by Student’s t test.
Fig. 5.
Fig. 5.. GABAergic amacrine cells are enriched for GAD-catalyzed GABA synthesis from glutamate and GABA transporter RNA expression.
(A) Dot plot color shows the relative level of RNA expression, and the diameter shows the percentage of cells expressing. PAX6 RNA selectively marks amacrine cells. GABAergic amacrine cells express GAD RNAs, and GLYCINEergic cells express the glycine transporter. Other retina and retina-related cells express little or no GAD RNAs. (B) GABAergic amacrine cells selectively express GABA transporter RNA. See figs. S1 to S3. Human cells are shown. The pig expression was similar, but pig amacrine cells were not separated into GABAergic and GLYCINEergic subsets.
Fig. 6.
Fig. 6.. Retinal GABA synthesis from glucose and subretinal injection of OSs restore glucose transport and GABA synthesis in RP pigs.
(A) Diagram of outer retina vasculature showing sites for injection of 13C metabolites in (B) and blood collection to quantify metabolite uptake from and transport to the choroid circulation in (C) (Materials and Methods). (B) MS showing incorporation of 13C from glucose into GABA and other metabolites in the retina in vivo in WT and RP pigs at P120 (Materials and Methods), whereas little-to-no incorporation of other metabolites into GABA was detected. n = 3. (C) Quantification of glucose uptake and secretion from the choroid circulation in WT, untreated RP, and RP pigs following subretinal injection of OSs at P120 (Materials and Methods). n = 6. Points represent the four individual vortex veins compared to three independent arterial blood collections per eye (Materials and Methods). (D) MS showing that total retinal glucose and GABA are restored to WT levels in RP pigs after subretinal OS transplant. n = 3. Significance was calculated by Student’s t test. Error bars are the standard error of the mean.
Fig. 7.
Fig. 7.. Aspartate-malate shuttle and GABA synthesis in GABAergic amacrine cells.
(A) Dot plot color shows the relative level of RNA expression, and the diameter shows the percentage of cells expressing. Genes important for GABA synthesis from glucose via the aspartate-malate shuttle are expressed in amacrine cells but not gene involved in degradation of putrescine to GABA or GABA synthesis from glutamate via α-ketoglutarate. (B) Illustration of RNA expression for aspartate-malate shuttle enzymes in GABAergic amacrine cells. Cit, citrate; Aco, aconitate; Isocit, isocitrate; aKG, α-ketoglutarate; Suc-CoA, succinyl coenzyme A; Suc, succinate; Fum, fumarate; Mal, malate. (C) The top shows an illustration of uniformly labeled (U) 13C glucose incorporation into M2 and M3 positions of glutamate and aspartate based on the metabolic pathway. Incorporation of retinal 13C glucose into M2 and M3 glutamate and aspartate is shown below. (D) MS showing that the retinal NAD (nicotinamide adenine dinucleotide)/NADH ratio is diminished in RP pigs and this ratio is restored by subretinal injection of OSs. Significance was calculated by Student’s t test. Error bars are the standard error of the mean. n = 3.
Fig. 8.
Fig. 8.. Model illustrating the transport of circulating glucose and light signaling in WT and RP.
Illustration of glucose transport from the choroid circulation to the outer retina, its metabolism to GABA, and the targeted ON bipolar signaling pathway. Glucose transport to the outer retina diminishes in RP with the loss of abundant rod OSs (ROSs), leading to reduced GABA synthesis centered in GABAergic amacrine cells. GABA is required to suppress the initial ON cone bipolar signal, and with reduced retinal GABA in RP, the cells become hyperresponsive to light. Transmission of this deregulated signal downstream to RGC causes an ON > OFF imbalance, highlighted by a positive PERG and diminished detection of changes in luminance and contrast. Retinal GABA synthesis can be restored in RP by subretinal injection of WT rod OSs that reestablish glucose transport from the RPE to the outer retina. The GABAA receptor agonist Ativan can restore cone pathway regulation for detection of luminance changes and contrast in the face of diminished retinal GABA in RP.

Similar articles

References

    1. Masland R. H., The neuronal organization of the retina. Neuron 76, 266–280 (2012). - PMC - PubMed
    1. Palczewski K., Chemistry and biology of vision. J. Biol. Chem. 287, 1612–1619 (2012). - PMC - PubMed
    1. Burkhardt D. A., Contrast processing by ON and OFF bipolar cells. Vis. Neurosci. 28, 69–75 (2011). - PubMed
    1. Sustar M., Holder G. E., Kremers J., Barnes C. S., Lei B., Khan N. W., Robson A. G., ISCEV extended protocol for the photopic On-Off ERG. Doc. Ophthalmol. 136, 199–206 (2018). - PMC - PubMed
    1. Ichinose T., Fyk-Kolodziej B., Cohn J., Roles of ON cone bipolar cell subtypes in temporal coding in the mouse retina. J. Neurosci. 34, 8761–8771 (2014). - PMC - PubMed

MeSH terms

LinkOut - more resources