Clinical Trial
. 2025 Jun 27;11(26):eadq2887.
doi: 10.1126/sciadv.adq2887. Epub 2025 Jun 27.

Phase 2/3 study evaluating safety, immunogenicity, and noninferiority of single booster dose of AVX/COVID-12 vaccine

Affiliations
Clinical Trial

Phase 2/3 study evaluating safety, immunogenicity, and noninferiority of single booster dose of AVX/COVID-12 vaccine

Constantino López-Macías et al. Sci Adv. .

Abstract

Low- and middle-income countries face substantial challenges in immunizing against severe acute respiratory syndrome coronavirus 2 (SARS-CoV-2), including high costs, limited access, and insufficient local manufacturing. To address these issues, we developed and locally manufactured the AVX/COVID-12 vaccine using a cost-effective Newcastle disease virus LaSota platform to express a stabilized SARS-CoV-2 spike protein (HexaPro-S). We evaluated the AVX/COVID-12 vaccine in a phase 2/3 parallel-group, double-blind, active-controlled, noninferiority trial with 4056 volunteers, demonstrating its safety, good tolerability, and ability to induce neutralizing antibodies against ancestral SARS-CoV-2 and the Omicron BA.2 and BA.5 variants. It also stimulated interferon-γ-producing CD8+ T cells and met the World Health Organization's noninferiority criteria compared to AZ/ChAdOx-1-S. No vaccinated participants experienced severe disease, hospitalization, or death. These findings support the use of AVX/COVID-12 as a booster to help achieve and maintain population immunity while addressing global inequities in vaccine distribution, and it has been approved for adult booster use in Mexico.


Figures

Fig. 1.
Fig. 1.. AVX phase 2/3 trial profile.
(A) Flowchart illustrating the study design and interventions applied to the recruited volunteers. (B) Diagram showing the total number of volunteers. (C) Allocation of volunteers to experimental groups, along with attrition rates and dropout’s postbooster throughout the study.
Fig. 2.
Fig. 2.. Similar neutralizing antibody responses were observed in participants who received booster doses of AVX or AZ.
Analysis of neutralizing antibody titers against the Wuhan-1 strain in participants who received booster doses of AVX (red circles) or AZ (gray squares). (A) Neutralizing antibody titers in all boosted participants on days 0 and 14. (B) Comparison of antibody titers between participants who seroconverted (closed symbols) and those who did not (open symbols). AVX, n = 705; AZ, n = 712. The GM ratio and their 95% CI were calculated using an analysis of covariance (ANCOVA) model adjusted for baseline titers, with data transformed to a natural logarithmic scale.
Fig. 3.
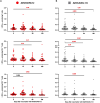
Fig. 3.. T cell responses in participants vaccinated with AVX or AZ vaccines.
(A) Percentage of IFN-γ–producing total, CD4+, and CD8+ T cells from PBMCs collected from participants who received booster doses of AVX or (B) AZ vaccine. The cells were stimulated with the subunit 1 of spike protein from the Wuhan ancestral strain, and the production of IFN-γ was assessed using flow cytometry. The limit of detection of the % IFN-γ producing was 0.006, and the graph shows individual values. The bars show GM, and the error shows the 95% CI. Statistically significant increases are annotated in black; this was observed only in IFN-γ–producing T cells from participants vaccinated with AVX. Statistically significant differences with decreases are annotated in red. The sample sizes for AVX were as follows: day 0, n = 53; day 14, n = 53; day 90, n = 44; day 180, n = 34. For AZ, the sample sizes were as follows: day 0, n = 50; day 14, n = 50; day 90, n = 40; day 180, n = 33. P values indicate statistical significance with P ≤ 0.05 for intragroup comparisons analyzed using the Wilcoxon signed-rank test.
Fig. 4.
Fig. 4.. AVX boosting induced neutralizing antibody titers against ancestral Wuhan-1 and Omicron SARS-CoV-2 VOCs.
Assessment of neutralizing antibody titers against the spike protein in sera from AVX-boosted volunteers using a pseudovirus neutralization assay. (A) Neutralizing antibody titers against Wuhan-1 or Omicron (BA.2 and BA.5) VOCs. (B) Specific neutralizing antibody titers against Wuhan-1 strain in participants with different histories of immunization and infection induced by AVX vaccine boost. Homologous boost refers to using the same vaccine platform used for the primary series vaccination; heterologous boost refers to using a different vaccine platform used for the primary series vaccination. ± Infection groups include infected and noninfected participants. The limit of detection was 60, although it is not indicated in the graph. For days 0 and 14, the number of participants was n = 218; for day 90, n = 195; and for day 180, n = 161. The dots in the figures represent the GM, while the bars indicate the 95% CIs. P values from the statistical analysis are shown in bold, with P ≤ 0.05 considered statistically significant. A paired t test was used to compare neutralizing titers.
Fig. 5.
Fig. 5.. AEs reported within 7 days after boosting with AVX or AZ during the safety phase.
AEs reported by participants following a booster dose of either AVX (n = 3120) or AZ (n = 936) vaccines are presented as follows: (A) The percentage of participants experiencing AEs, categorized by severity; (B) participants with local AEs of special interest (AESIs); (C) participants with systemic AESIs; and (D) participants with vaccine-associated AEs (VAAEs) confirmed to be related to the vaccine. “General” refers to disorders affecting the entire organism and those at the immunization site. These disorders, as well as all others depicted in the graphs, are defined in tables S3 to S6. P values were calculated using a z test for proportions, with statistically significant differences indicated at P ≤ 0.05.

References

    1. WHO COVID-19 dashboard, https://covid19.who.int/.
    1. COVID-19 pandemic, https://ourworldindata.org/coronavirus.
    1. COVID19 vaccine tracker, https://covid19.trackvaccines.org/.
    1. Cheng H., Peng Z., Luo W., Si S., Mo M., Zhou H., Xin X., Liu H., Yu Y., Efficacy and safety of COVID-19 vaccines in phase III trials: A meta-analysis. Vaccines (Basel) 9, 582 (2021). - PMC - PubMed
    1. Global dashboard for vaccine equity, 18 April 2021; https://data.undp.org/vaccine-equity/.

Publication types

MeSH terms