. 2025 Jun 27;11(26):eadt8073.
doi: 10.1126/sciadv.adt8073. Epub 2025 Jun 27.

Global health risks lurking in livestock resistome

Affiliations

Global health risks lurking in livestock resistome

Bintao Li et al. Sci Adv. .

Abstract

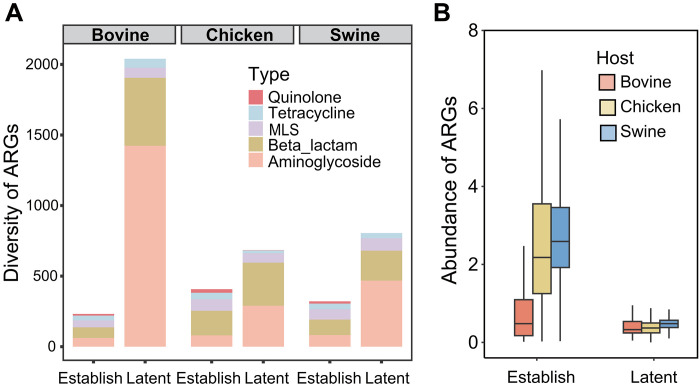
Livestock farming consumes more than 70% of global antibiotics annually, making livestock manures an important vector of anthropogenically influenced antibiotic resistance genes (ARGs). The global pattern of the livestock resistome, its driving mechanisms, and transmission potential to the clinic are not well assessed. We analyzed 4017 livestock manure metagenomes from 26 countries and constructed a comprehensive catalog of livestock ARGs and metagenome-assembled genomes. Livestock resistome is a substantial reservoir of known (2291 subtypes) and latent ARGs (3166 subtypes) and is highly connectable to human resistomes. We depicted the global pattern of livestock resistome and prevalence of clinically critical ARGs, highlighting the role of farm and human antibiotic stewardship in shaping livestock resistome. We developed a risk-assessment framework by integrating mobility potential, clinical significance, and host pathogenic relevance, and prioritized higher risk livestock ARGs, producing a predictive global map of livestock resistome risks that can help guide research and policy.


Figures

Fig. 1.
Fig. 1.. ARGs in livestock manures, human feces, and typical ARG reservoirs.
(A) Geographic distribution of 4017 livestock manure metagenomes. (B) Pan-resistome of livestock manure. (C) ARG diversity and (D) ARG abundance in livestock manures and typical ARG reservoirs. Each dot represents a single metagenome. (E) Average abundance and prevalence of ARGs across livestock manure samples. The red lines across the top and on the right side represent density distribution of ARGs. (F) PCoA showing dissimilarities in resistome profile among various environments. Two hundred metagenomes for each type of animal manure were randomly selected for plotting the resistome profile. (G) ARGs shared between the human feces and livestock manures (drawn by Figdraw, www.figdraw.com).
Fig. 2.
Fig. 2.. Latent and established ARGs in livestock manures.
(A) Comparison in diversity between latent and established ARGs. (B) Comparison in abundance between established and latent ARGs. Latent ARGs were predicted by fARGene and established ARGs were identified with ARGs-OAP.
Fig. 3.
Fig. 3.. Phylogenetic tree of metagenome-assembled genomes (MAGs) constructed from livestock metagenomes.
Each branch of the phylogenetic tree represents a MAG constructed from metagenomes. The background colors indicate different phyla. The first and second circles from the inside out represent the continent and animal host of each MAG, respectively. The heatmap shows the proportion of different ARG classes carried by each MAG. The bar plot illustrates the diversity of ARGs harbored by each MAG. The blue triangle on the second outermost rings indicates the presence of virulence factors in a MAG. The box shows that MAGs carrying a high diversity of ARGs were primarily mainly classified to Enterobacteriaceae.
Fig. 4.
Fig. 4.. A risk assessment framework prioritizing ARGs in livestock manures.
(A) A schematic map showing the concept and procedures to construct the risk assessment framework. The framework is fundamentally based on three-dimensional measurements: mobility (M), clinical significance (C), and host pathogenic relevance (H). (B) The relative range of different risk indicators for various types of ARGs. Relative ranges represent calculated values for different indicators. The details of these messages are shown in tables S5 to S10. (C) Distribution of ARGs categorized into four risk levels: R1, R2, R3, and R4. Pie chart and bar graph for all ARGs. The threshold of 0 was selected to represent cases where ARGs received a score of zero in at least one risk evaluation dimension. The thresholds of 1 and 0.2 were empirically determined based on the distribution of risk scores as shown in the bar graph. (D) List of high-risk ARGs (R1) in livestock manure.
Fig. 5.
Fig. 5.. Global pattern of livestock resistomes.
(A) Resistome abundance and (B) ARG diversity in three types of animal manures across countries. (C) Prevalence of clinical critical ARGs across continents and countries. The bar chart on the right illustrates the total prevalence of ARGs in livestock manure. (D) Temporal change in resistome abundance in six major livestock-producing countries.
Fig. 6.
Fig. 6.. A predictive global map of resistome risk scores in livestock manure.
(A) A schematic overview of machine learning used to predict risk scores of global livestock resistomes. (B) Mean square error (MSE) assessments. (C) Correlation between predictive and true risk scores. (D) Top 16 factors used to predict risk scores in livestock resistomes. The full name of each factor can be found in Supplementary Data. (E) A predictive map of risk scores in global chicken and swine resistomes in 2022. The color scale represents absolute risk score. Countries filled with white color were excluded from the risk prediction because of no livestock production.

Similar articles

References

    1. Tiseo K., Huber L., Gilbert M., Robinson T. P., Van Boeckel T. P., Global trends in antimicrobial use in food animals from 2017 to 2030. Antibiotics 9, 918 (2020). - PMC - PubMed
    1. Black Z., Balta I., Black L., Naughton P. J., Dooley J. S. G., Corcionivoschi N., The fate of foodborne pathogens in manure treated soil. Front. Microbiol. 12, 781357 (2021). - PMC - PubMed
    1. Lawther K., Santos F. G., Oyama L. B., Rubino F., Morrison S., Creevey C. J., McGrath J. W., Huws S. A., Resistome analysis of global livestock and soil microbiomes. Front. Microbiol. 13, 897905 (2022). - PMC - PubMed
    1. Mulchandani R., Wang Y., Gilbert M., Van Boeckel T. P., Global trends in antimicrobial use in food-producing animals: 2020 to 2030. PLOS Glob. Public Health 3, e0001305 (2023). - PMC - PubMed
    1. Van Boeckel T. P., Pires J., Silvester R., Zhao C., Song J., Criscuolo N. G., Gilbert M., Bonhoeffer S., Laxminarayan R., Global trends in antimicrobial resistance in animals in low- and middle-income countries. Science 365, eaaw1944 (2019). - PubMed