. 2025 Aug 14;121(9):1359-1372.
doi: 10.1093/cvr/cvaf112.

Delineation of a thrombin receptor-stimulated vascular smooth muscle cell transition generating cells in the plaque-stabilizing fibrous cap

Affiliations

Delineation of a thrombin receptor-stimulated vascular smooth muscle cell transition generating cells in the plaque-stabilizing fibrous cap

James C K Taylor et al. Cardiovasc Res. .

Abstract

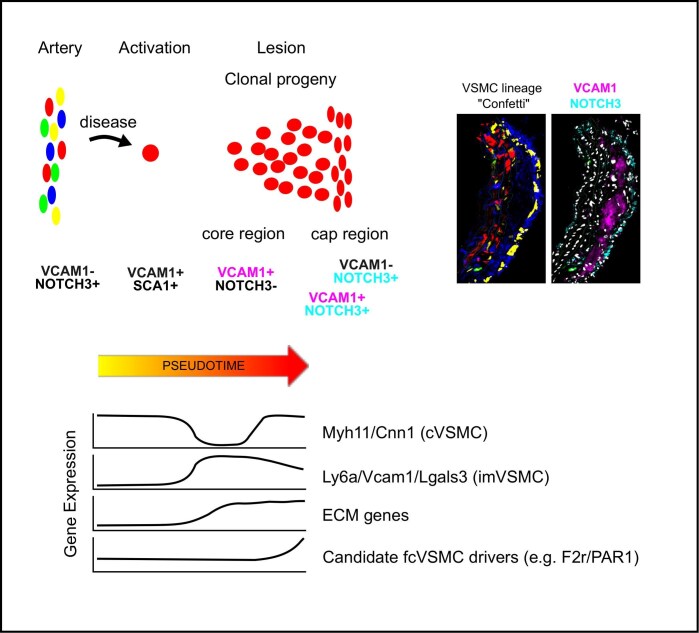
Aims: Vascular smooth muscle cells (VSMCs) accumulate in atherosclerotic plaques and exhibit remarkable phenotypic plasticity, contributing to both plaque growth and stability. The plaque-stabilizing fibrous cap is rich in VSMC-derived cells, yet the cellular transitions and regulatory mechanisms governing fibrous cap formation remain unclear. Here, we aimed to identify the VSMC phenotypic transitions associated with this critical process.

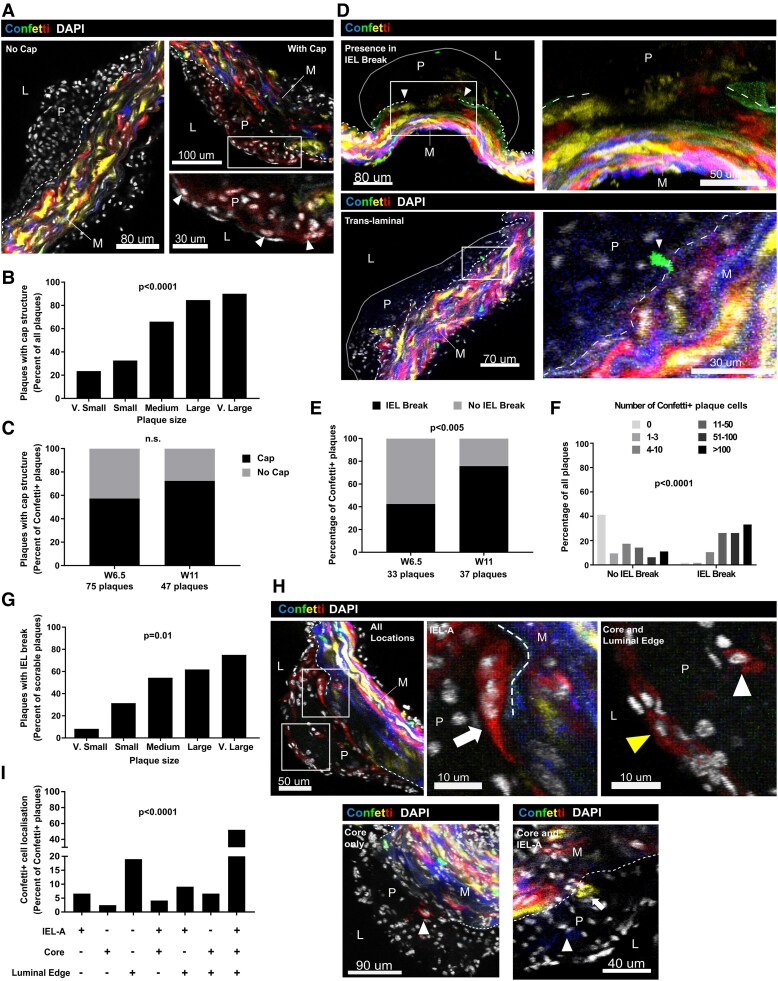
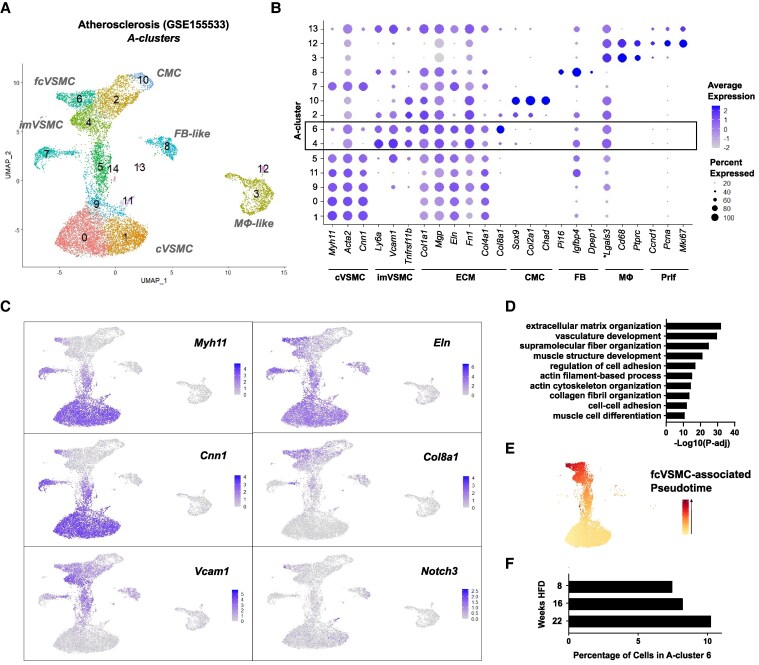
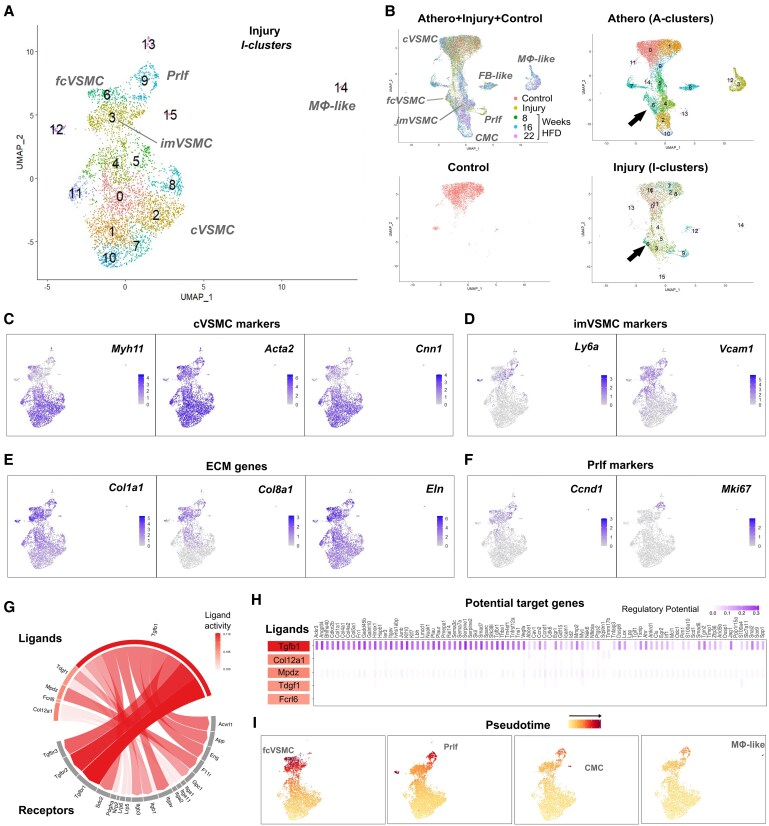
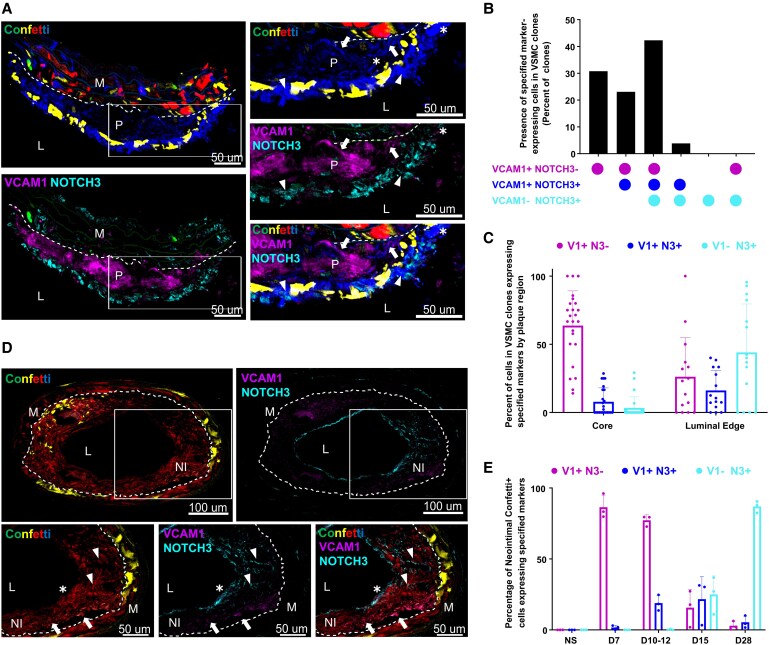
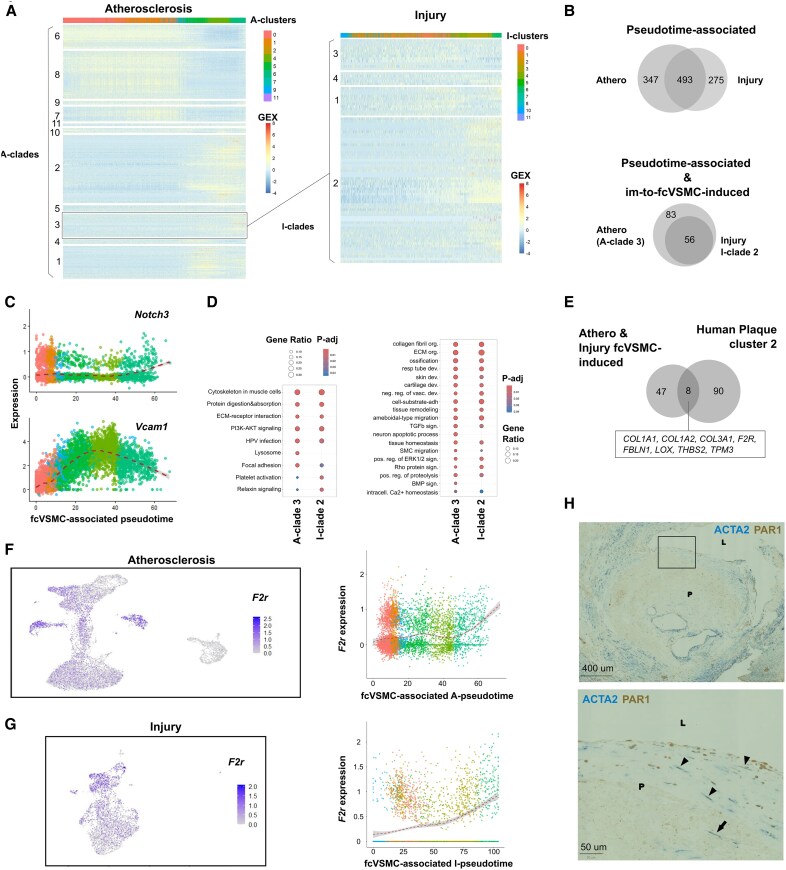
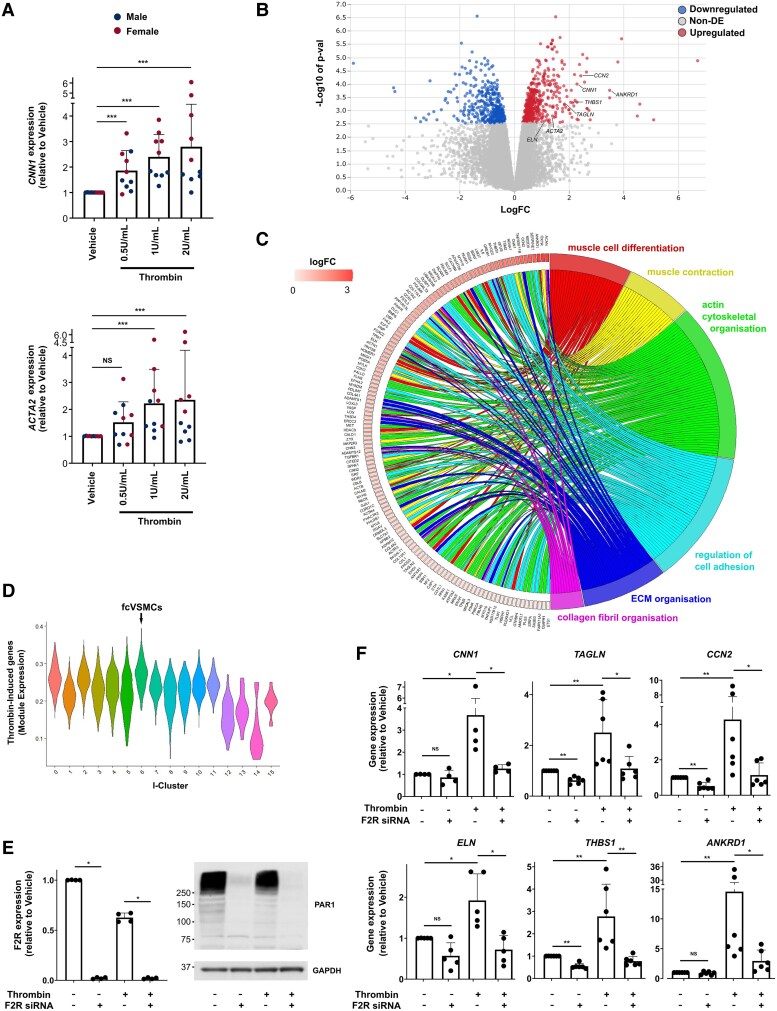
Methods and results: Mapping of lineage-traced VSMCs during plaque development revealed investment of VSMCs prior to fibrous cap formation. Using single-cell RNA-sequencing (scRNA-seq) profiles of lineage-traced VSMCs from atherosclerotic and acutely injured mouse arteries, we identified a disease-specific VSMC state co-expressing contractile genes with extracellular matrix (ECM) components (including fibrillar collagens and elastin) and NOTCH3, which are associated with fibrous cap formation. Computational trajectory analysis predicted that this proposed fibrous cap-related VSMC (fcVSMC) state arises from a previously described plastic, intermediate VSMC population expressing SCA1 and VCAM1. Clonal analysis further showed that NOTCH3+ fcVSMCs derive from intermediate VSMCs in both atherosclerosis and an acute vascular injury model, suggesting a conserved disease-relevant mechanism. The fcVSMCs were enriched in plaque fibrous caps compared to lesion cores, consistent with a role in fibrous cap formation. By combining scRNA-seq trajectory analysis and spatial transcriptomics of human atherosclerotic plaques, we identified protease-activated receptor-1 (PAR1) as a candidate regulator of fcVSMC generation. PAR1 was expressed by VSMCs in human plaque fibrous caps and PAR1 activation by thrombin induced expression of contractile genes and ECM components associated with the fcVSMC state in human VSMCs.

Conclusion: Our findings identify a VSMC transition linked to fibrous cap formation in atherosclerosis and show this is modelled by vascular injury. We identify VSMC-expressed PAR1 as a potential therapeutic target for promoting plaque stability by driving the transition to the matrix-producing, fibrous cap-associated VSMC state.

Keywords: Atherosclerosis; Fibrous cap; Phenotypic switching; Protease-activated receptor-1; Vascular smooth muscle cells.


Conflict of interest statement

Conflict of interest: H.F.J. is a key opinion leader for and is funded by Novo Nordisk A/S.

Figures

Graphical Abstract
Graphical Abstract
Figure 1
Figure 1
VSMC infiltration in atherosclerosis occurs prior to generation of a fibrous cap. Analysis of Confetti + cells in plaques from VSMC-lineage-labelled Myh11Confetti; Apoe−/− animals fed a HFD for 6.5 or 11 weeks (W). (A) Representative confocal images (single Z-stack) of plaques without (left) and with fibrous cap structure (arrowheads, right). Magnified view of the boxed region (lower right). Scale bars = 80 μm (left), 100 μm (top right), and 30 μm (lower right). (B) Percent of all plaques with fibrous cap structure according to plaque size. n = 150 plaques; n = 17 very (v) small, 49 small, 47 medium, 27 large, 10 v. large. P < 0.001, X2, and df = 4. (C) Percent of plaques containing Confetti+ cells stratified by time of HFD feeding. n = 122 plaques; n = 75 plaques from four animals at W6.5 and n = 47 plaques from three animals at W11. P = 0.09, X2, and df = 1. (D) Representative plaques (max. projection) with Confetti+ cells at an IEL break (top) or ‘translaminal’ Confetti+ cells crossing an intact IEL (lower panels). Magnified views show boxed regions (right). Arrowheads: IEL breakpoints (top) and translaminal Confetti+ cell (lower). Scale bars = 80 μm (top-left), 50 μm (top-right), 70 μm (bottom-left), and 30 μm (bottom-right). (E) Proportion of Confetti+ cell-containing plaques with an IEL break, stratified by time of HFD. n = 70 plaques from four animals (W6.5) and 37 plaques from three animals (W11). P = 0.005, X2, and df = 1. (F) Distribution of plaques by number of Confetti+ cells per plaque, for lesions without (54 plaques) or with an IEL break (43 plaques). P < 0.0001, X2, and df = 5. (G) Percent of plaques with IEL break, stratified by plaque size (9 v. small, 29 small, 35 medium, 17 large, 7 v. large). P = 0.04, X2, and df = 4. (F, G) Plaques were excluded if IEL status could not be confidently scored. (H) Representative confocal images (top, single Z-plane; lower panels, max. projection) of plaques showing Confetti+ cells in all plaque regions (top), core only (lower left), or core and ‘IEL-adjacent’ (IEL-A, lower right). Magnified views of boxed regions show IEL-A (middle) and ‘core and luminal edge’ located Confetti+ cells (right). Confetti+ cells at the IEL-A (white arrows), Confetti+ cells at the luminal edge (yellow arrowhead), and Confetti+ cells in the plaque core (white arrowheads) are marked. (I) Distribution of plaque regions with Confetti+ cells for plaques with Confetti+ cell investment (n = 122 plaques). P < 0.0001, X2, and df = 6. (A, D, H) Confetti (CFP = blue, RFP = red, YFP = yellow, and GFP = green) and DAPI (white) signals are shown as indicated. Plaque outlines (grey line) and internal elastic lamina (IEL, dashed line) are marked. L, lumen; P, plaque, M, media.
Figure 2
Figure 2
Identification of a proposed fibrous cap-associated VSMC state derived from intermediate modulated VSMCs. (A) Uniform manifold approximation and projection (UMAP) showing scRNA-Seq profiles of VSMC-lineage label-positive cells from atherosclerotic arteries of Myh11-CreERt2; reporter-ZsGreen; Apoe−/− animals (GSE155513) and healthy control Apoe+/+ carotid arteries. Atherosclerosis cell clusters (A-clusters) and VSMC states are annotated. (B) Dot plot showing expression of VSMC-state marker genes in clusters using a grey (low) to blue (high) scale and the percentage of cells with detected marker expression for each cluster indicated by dot size. cVSMC, contractile VSMC; imVSMC, intermediate modulated VSMC; ECM, extracellular matrix; CMC, chondromyocyte; FB, fibroblast; MΦ, macrophage; Prlf, proliferation. *Lgals3 is also expressed by imVSMCs. (C) UMAP feature plots showing expression levels for cVSMC (Myh11, Cnn1), ECM (Eln, Col8a1, Col4a1), the imVSMC gene Vcam1, and Notch3 using grey (low) to blue (high) scales. (D) GO terms enriched for genes up-regulated in A-cluster 6 compared to A-cluster 4 cells. P-adj: cumulative hypergeometric probability testing with g:SCS correction. (E) UMAP showing the cells included in the inferred trajectory generating A-cluster 6 cells. Pseudotime is indicated using a yellow–red scale. (F) Proportion of VSMC-lineage cells mapping to A-cluster 6 at each HFD time point.
Figure 3
Figure 3
VSMCs generate the transcriptional fibrous cap-associated VSMC state 11 days after vascular injury. (A) Uniform manifold approximation and projection (UMAP) showing injury (I) cell cluster annotation and VSMC states for scRNA-Seq analysis of VSMC-lineage label positive cells from ligated left carotid arteries of Myh11eYFP animals 11 days post-injury (DPI). (B) Integration of injury, atherosclerosis, and healthy control carotid arteries scRNA-Seq datasets. Top left: all cells coloured by dataset identity; top right: cells from the atherosclerosis data only, A-clusters annotated (see Figure 2A); lower left: cells from healthy arteries only, lower right: injury data, I-clusters annotated (panel A). (C-F) UMAP feature plots showing expression levels for markers of cVSMC (C), imVSMC (D), ECM (E), and proliferation (F) using grey (low) to blue scales (high). (G, H) Top 5 ligands and their associated receptors (G, arrow width indicates predicted strength) or regulatory potential for top 100 gene targets (H). Predicted ligand strength is indicated by shades of orange/red, regulatory potential in shades of purple. (I) UMAP showing the cells included the inferred trajectories leading to generation of a Prlf (I-cluster 9), CMC (I-cluster 15), MΦ-like or fibrous cap-associated (fcVSMC; I-cluster 6) cell state. Pseudotime is indicated using a yellow–red scale. cVSMC, contractile VSMC; imVSMC, intermediate modulated VSMC; CMC, chondromyocyte; FB, fibroblast; MΦ, macrophage; Prlf, proliferation.
Figure 4
Figure 4
VSMCs in the intermediate modulated and fibrous cap-associated state co-occur in clonally related cells within lesions. (A-C) Immunofluorescence staining for VCAM1 and NOTCH3 in cryosections of a plaque from VSMC-lineage-labelled Myh11Confetti; Apoe−/− animals. (A) Representative image of plaque, showing the entire plaque (left) or magnified views of boxed region (right). Examples of VCAM1+ (arrows), NOTCH3+ (arrowheads), and VCAM1+NOTCH3+ cells (asterisk) are indicated. Scale bars = 50 µm. (B) Percentage of plaque-located Confetti+ clones that contain cells expressing specified combinations of markers. Dots represent clones (n = 26) from 16 plaques in three animals. (C) Percentage of cells with specified combinations of marker expression quantified separately for either the core or luminal edge portion of individual Confetti+ clones. n = 23 (core region) and 15 clones (luminal edge). Bars show mean, error-bars SD. (D, E) Immunofluorescence staining for VCAM1 and NOTCH3 in cryosections of the ligated artery of VSMC-lineage-labelled Myh11Confetti animals. (D) Representative image (15 days post-injury) showing entire section (top; scale bar = 100 µm) and magnified views of boxed regions (bottom; scale bar = 50 µm). Examples of VCAM1+ cells in the neointima (arrows), NOTCH3+ cells in the neointima (arrowheads) and cells expressing both VCAM1 and NOTCH3 (asterisk) are marked. (E) The proportion of neointimal Confetti+ cells with specified marker expression at different time points after injury (n = 3 animals per time point). Bars show mean, error-bars SD. (A, D) Signals show VCAM1 (magenta), NOTCH3 (cyan), and Confetti (CFP: blue, RFP: red, YFP: yellow, and GFP: green) as indicated. Dashed lines outline the internal elastic lamina. L, lumen; P, plaque, M, media; NI, neointima.
Figure 5
Figure 5
Identification of PAR1 as a candidate regulator of VSMC differentiation to a fibrous cap-associated VSMC state. (A) Heatmap of pseudotime-dependent genes [P-adj < 0.05, log(fold-change) > 0.25] for the fcVSMC-associated trajectory in atherosclerosis clustered into ‘A-gene clades’ (left), and A-clade 3 genes clustered into ‘I-gene clades’ by expression along fcVSMC-associated pseudotime in injury (right). Cluster affiliation (top) is shown using Figures 2A (A-clusters, left) and 3A (I-clusters, right) colour scales. Blue (low)-to-red (high) colour-scale shows scaled gene expression. (B) Overlap of all fcVSMC pseudotime-associated genes in atherosclerosis and injury (top) and intersection of A-clade 3 and I-clade 2 genes (lower panel). (C) Notch3 and Vcam1 expression along pseudotime for fcVSMC generation in injury. Dashed line shows a GAM. (D) Selected gene ontologies enriched in A-clade 3 and I-clade 2 genes (see Supplementary material online, Tables S8-S11). P-adj: cumulative hypergeometric probability testing with g:SCS correction. (E) Venn diagram for common fcVSMC-induced genes (I-clade 2) and genes induced in human fibrous cap-located spatial transcriptomics capture spots. The eight overlapping genes are listed. (F, G) F2r feature plots (left) and pseudotime-dependent expression in atherosclerosis (F) and injury (G). (H) Representative immunohistochemistry staining for ACTA2 and PAR1 in sections of human carotid plaques (n = 5). Panels show a large region of the plaque (top) and a magnified view of the boxed region (bottom). Signals for ACTA2 (blue) and PAR1 (brown) are shown as indicated. Examples of ACTA2 + PAR1+ cells in the cap (arrowheads) and ACTA2 + PAR1+ cells (arrow) in the core are shown. Scale bars = 400 µm (top), 50 µm (bottom). L, lumen; P, plaque, M, media.
Figure 6
Figure 6
PAR1 stimulation induces a transcriptional pattern associated with fibrous cap cells. (A) Transcript levels (qRT-PCR) of contractile genes CNN1 and ACTA2 in primary human VSMC (hVSMC) isolates from different donors (n = 5 male, blue, and 5 female donors, red) after 24 h vehicle or thrombin treatment (0.5, 1, or 2 U/mL). (B) Volcano plot showing differential gene expression between thrombin-treated (2 U/mL) vs. vehicle control samples (n = 3 female donors). Differentially expressed genes are coloured (P-adj < 0.05, red: induced by thrombin, blue: reduced by thrombin) and genes of interest indicated. See Supplementary material online, Table S12. (C) VSMC- and ECM-associated GO terms enriched in thrombin-induced genes and associated differentially expressed genes [white-red scale, log(fold-change)]. (D) Violin plot showing expression of thrombin-induced gene orthologues across the injury cell clusters. The arrow marks fcVSMC I-cluster 6. (E) F2R transcript levels (left, normalized to vehicle treated, n = 4) and western blot (right; molecular weight in kDa, n = 3) in primary hVSMCs ± thrombin with F2R-targeting (+) or control siRNA (−). (F) Transcript levels of candidate target genes in thrombin-treated hVSMCs relative to vehicle-treated samples with F2R-targeting (+) or control siRNA (−). n = 4–6. (A, E, F) Bars show mean ± SD relative to vehicle. *P-adj < 0.05, **P-adj < 0.01, ***P-adj < 0.001, NS: not significant (Mann–Whitney with Bonferroni-correction, following Kruskal–Wallis with P < 0.05). Replicates are hVSMC lines from different donors.

Similar articles

References

    1. Basatemur GL, Jørgensen HF, Clarke MCH, Bennett MR, Mallat Z. Vascular smooth muscle cells in atherosclerosis. Nat Rev Cardiol 2019;16:727–744. - PubMed
    1. Gomez D, Shankman LS, Nguyen AT, Owens GK. Detection of histone modifications at specific gene loci in single cells in histological sections. Nat Methods 2013;10:171–177. - PMC - PubMed
    1. Yang P, Hong MS, Fu C, Schmit BM, Su Y, Berceli SA, Jiang Z. Preexisting smooth muscle cells contribute to neointimal cell repopulation at an incidence varying widely among individual lesions. Surgery 2016;159:602–612. - PMC - PubMed
    1. Nemenoff RA, Horita H, Ostriker AC, Furgeson SB, Simpson PA, VanPutten V, Crossno J, Offermanns S, Weiser-Evans MCM. SDF-1a; induction in mature smooth muscle cells by inactivation of PTEN is a critical mediator of exacerbated injury-induced neointima formation. Arterioscler Thromb Vasc Biol 2011;31:1300–1308. - PMC - PubMed
    1. Gomez D, Owens GK. Smooth muscle cell phenotypic switching in atherosclerosis. Cardiovasc Res 2012;95:156–164. - PMC - PubMed