. 2025 Jul:117:105821.
doi: 10.1016/j.ebiom.2025.105821. Epub 2025 Jun 26.

Genetic transcriptional regulation profiling of cartilage reveals pathogenesis of osteoarthritis

Affiliations

Genetic transcriptional regulation profiling of cartilage reveals pathogenesis of osteoarthritis

Wen Tian et al. EBioMedicine. 2025 Jul.

Abstract

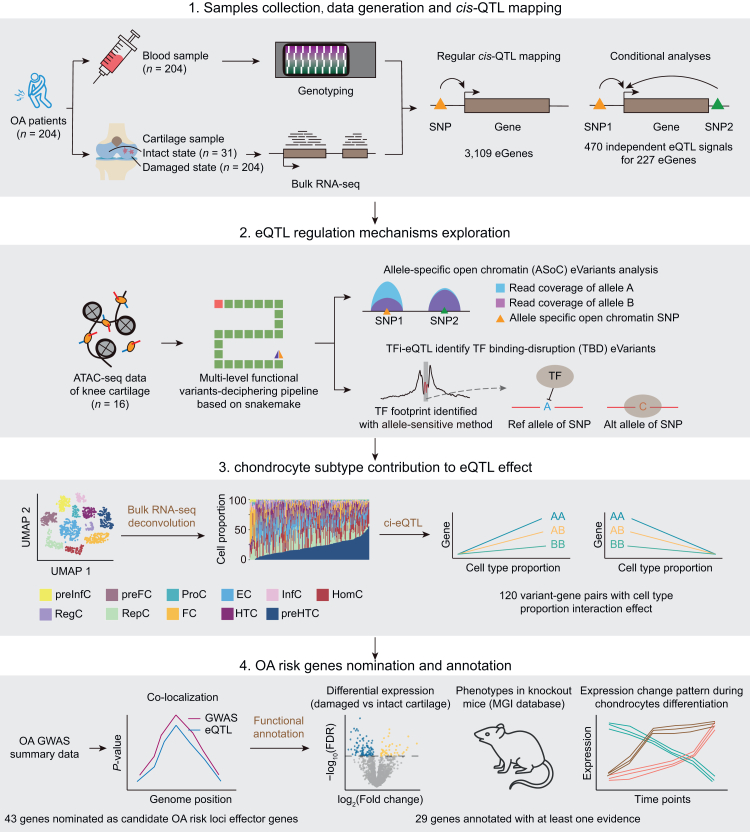
Background: Genome-wide association studies (GWAS) have identified more than one hundred risk loci for osteoarthritis (OA). Identifying the effector genes and deciphering the underlying regulatory mechanisms are of great importance but remains challenging due to limited availability of OA-related tissue data. This study aims to address this issue by generating a cartilage expression quantitative trait loci (eQTLs) and a functional fine-mapping resource.

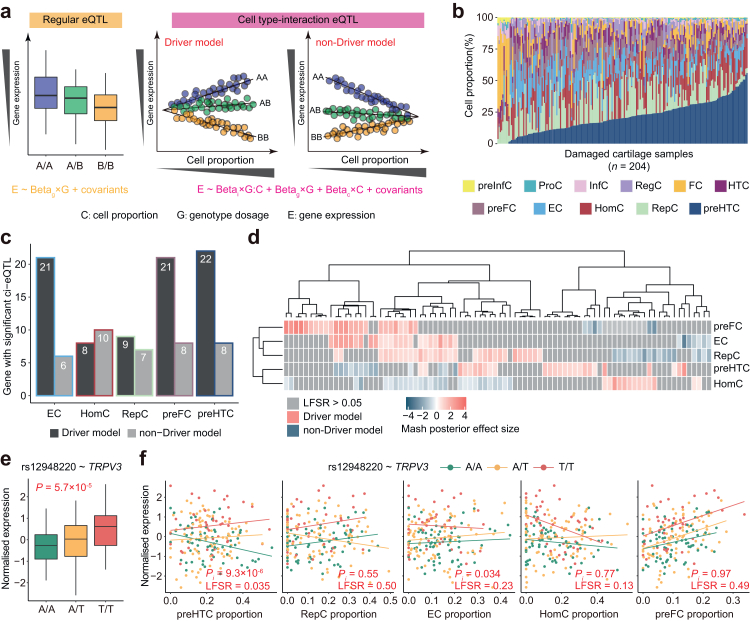
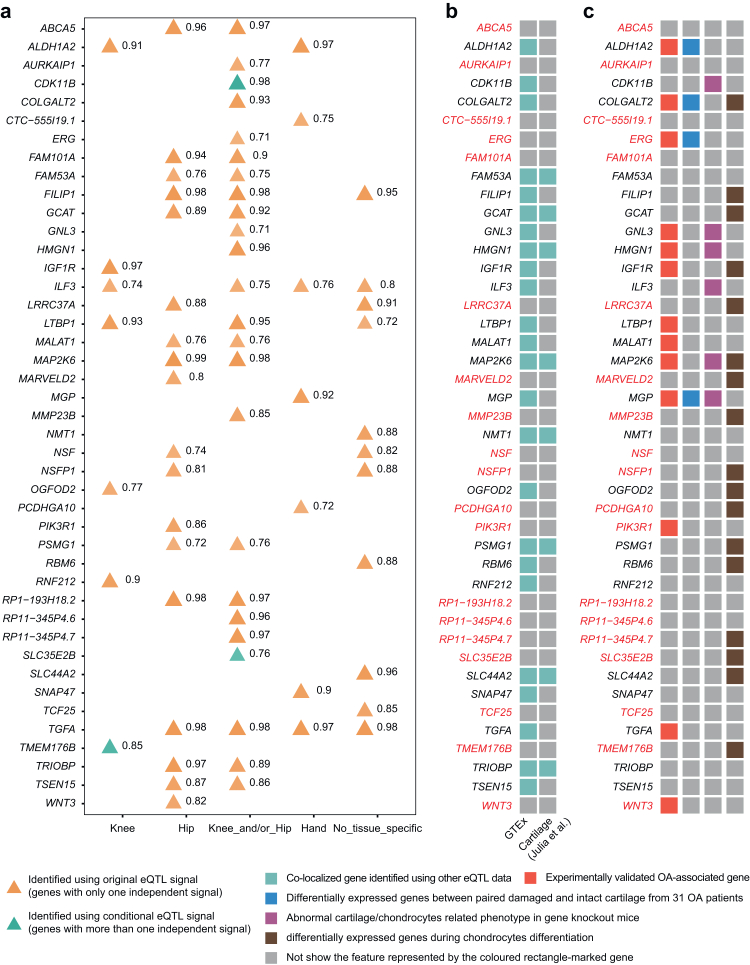
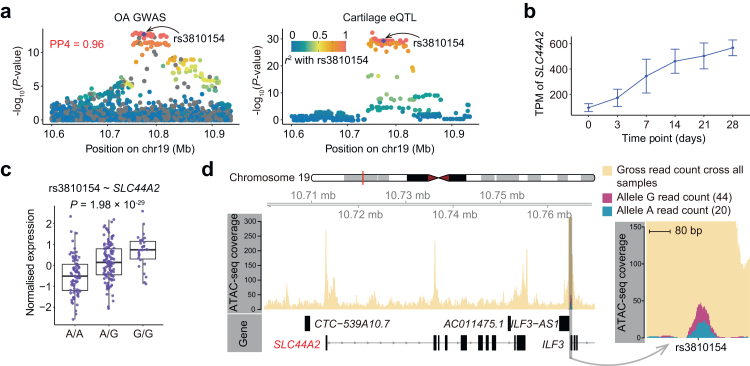
Methods: We performed cis-eQTL analysis using genomics and cartilage transcriptomics data from 204 patients with OA (largest sample size to date). Cell type-interaction eQTL analysis (ci-eQTL) was conducted to explore the chondrocyte subtype dependency of eQTL effects. Co-localization analysis was used to nominate effector genes of OA GWAS risk loci. A deciphering pipeline was established to identify candidate causal variants in eQTL loci that regulate gene expression through the alteration of chromatin accessibility or disruption of transcription factors (TFs) binding to regulatory elements.

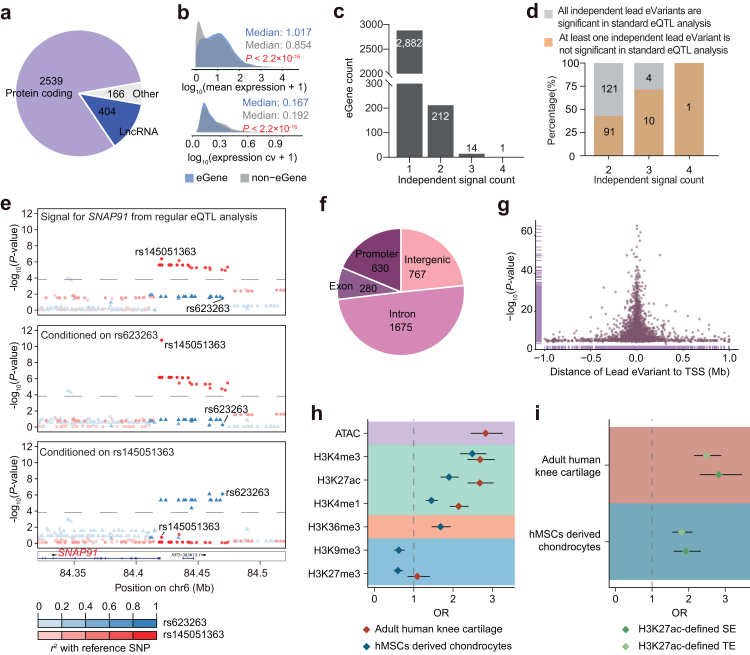
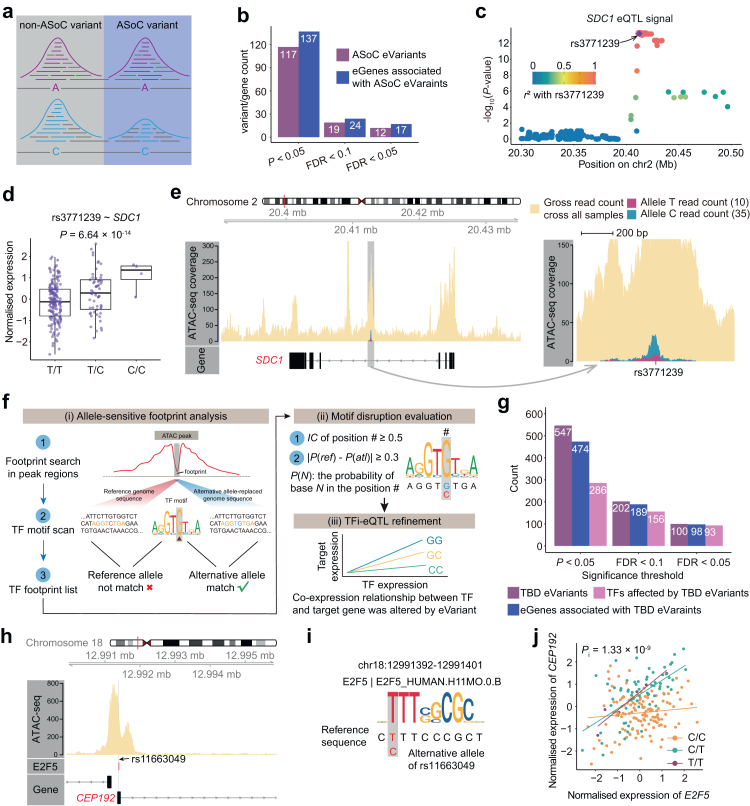
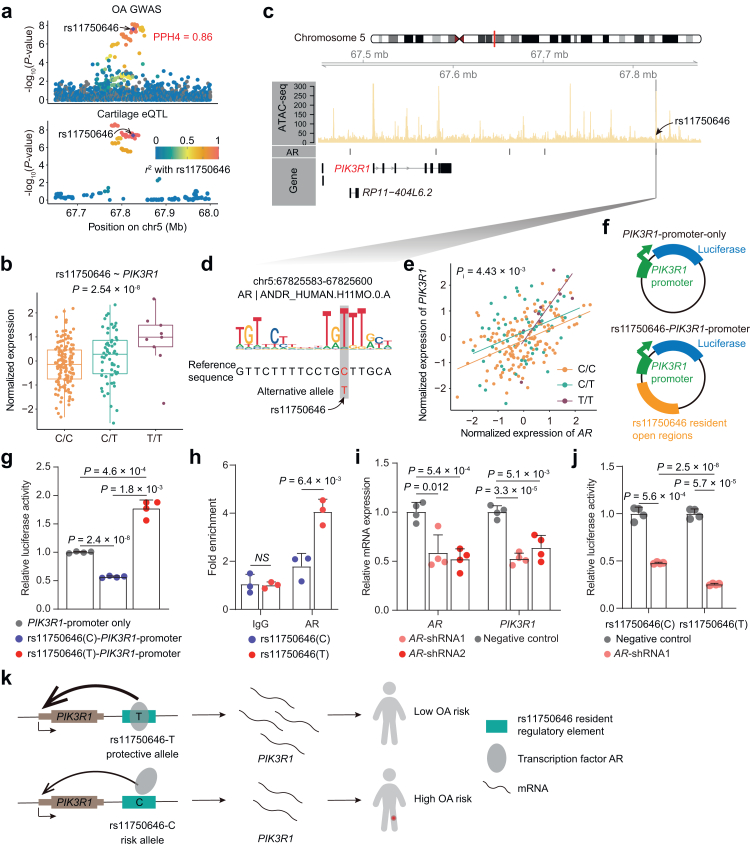
Findings: We identified 3352 independent eQTLs for 3109 genes, 120 eQTL-gene pairs showed chondrocyte subtype dependency. We identified 19 new OA risk genes. We identified 117 causal eQTLs exhibiting allele-specific open chromatin (ASoC) and 547 eQTLs involved in transcription factor binding disruption (TBD). Functional validation showed that the T allele of the OA risk variant rs11750646 enhances the AR binding affinity to an open chromatin region, thereby promoting the expression of the OA-related gene PIK3R1.

Interpretation: Our findings provide insights into the unique regulatory landscape of cartilage and elucidate potential mechanisms underlying OA pathogenesis.

Funding: This work was supported by National Natural Science Foundation of China (32470639, 82372458, and 82170896); Science Fund for Distinguished Young Scholars of Shaanxi Province (2025JC-JCQN-054); Innovation Capability Support Program of Shaanxi Province (2022TD-44, 2024RS-CXTD-86); Key Research and Development Project of Shaanxi Province (2023-YBSF-180); China Postdoctoral Science Foundation (2024M752561); and the Fundamental Research Funds for the Central Universities.

Keywords: Cartilage; Fine-mapping; Osteoarthritis; eQTL.


Conflict of interest statement

Declaration of interests The authors declare no competing interests.

Figures

Fig. 1
Fig. 1
Overview of the study. A total of 204 knee cartilage samples in the damaged state and 31 cartilage samples in the intact state were collected from 204 patients with OA for bulk RNA-seq, along with matched 204 blood samples from the same donors for DNA genotyping. We performed cis-eQTL mapping using expression data from cartilage samples in the damaged state, followed by conditional analysis to identify independent eQTL signals for each eGene. Using our multi-level functional variant-deciphering pipeline, we conducted functional fine-mapping based on epigenetic features derived from 16 cartilage ATAC-seq data to identify candidate causal eVariants that may regulate gene expression by altering chromatin accessibility and transcription factor (TF) binding. Finally, by integrating eQTL data with OA GWAS summary data, we identified effector genes at OA risk loci. These genes were annotated for their roles in OA using various lines of evidence, including differential expression between cartilage samples in the damaged and intact states, abnormal cartilage or chondrocyte phenotypes in gene knockout mice (Mouse Genome Informatics database), and expression change pattern during chondrocyte differentiation.
Fig. 2
Fig. 2
cis-eQTL results. a, Pie chart showing biotype distribution of eGenes. b, Comparison of expression levels and variability between significant eGenes and non-eGenes. The x-axis shows log-transformed mean expression (top panel) and coefficients of variation (bottom panel). P-values were calculated using Wilcoxon rank-sum test. c, Number of genes with varying numbers of independent signals after conditional analysis. d, Distribution of eGenes with or without newly identified independent signal (not significant in original cis-eQTL analysis) after conditional analysis. e, Two independent eQTL signals for SNAP91 are tagged by rs145051363 (middle) and rs623263 (bottom), respectively. In regular cis-eQTL analysis, only the rs145051363-tagged signal is significant (top). f, Genomic distribution of lead eVariants of all independent eQTLs. g, Distance of lead eVariants of all independent eQTLs from the transcription start site (TSS) of their target genes, and corresponding nominal statistical significance (−log10(P-value)). h, Enrichment of lead eVariants in different epigenetic features, shown as odds ratios (OR) ± 95% confidence intervals. The epigenetic features were derived from adult human knee cartilage and hMSCs-derived chondrocytes. Note that ATAC-seq data are unavailable for hMSCs-derived chondrocytes, and H3K36me3 and H3K9me3 ChIP-seq data are missing from adult human knee cartilage. i, Enrichment of lead eVariants in H3K27ac-defined SEs and TEs from both adult human knee cartilage and hMSCs-derived chondrocytes, data are shown as odds ratios (OR) ± 95% confidence intervals.
Fig. 3
Fig. 3
Functional fine-mapping identifies candidate causal variants and regulatory mechanisms. a, Schematic of an allele-specific open chromatin variant. b, Number of eVariants annotated as ASoC variants, along with their associated eGene at different significance thresholds. c, Plot showing the eQTL signal associated with SDC1. The y-axis represents statistical significance (−log10(P-value)) and the x-axis shows the chromosome coordinate. d, Association between rs3771239 genotypes and SDC1 expression. The y-axis shows normalised SDC1 expression; the x-axis shows rs3771239 genotypes. The whiskers extend to the 5th and 95th percentiles. The P-value was reported by FastQTL nominal procedure. e, rs3771239 is located within an open chromatin region marked by an ATAC-seq peak in an intron of SDC1 and affects local chromatin accessibility, with C allele reads showing higher peak intensity than A allele reads. f, Schematic of TF binding-disruption analysis. Three main steps included. We supposed there was a possible scenario where the reference genome-stored allele of a SNP may strongly disrupt a TF motif and the alternative allele may help to form a sequence context suitable for TF binding. So, in the allele-sensitive TF footprint analysis step (step 2), we introduced both the original reference genome sequence and the allele-replaced genome sequence corresponding to the signal valley regions as inputs for TF motif search. In this example scenario, only the alternative allele-replaced genome sequence matched to the TF motif. g, Number of eVariants annotated as TBD variants, with corresponding eGenes and affected TFs at different statistical significance thresholds. h, rs11663049 overlaps with an E2F5 footprint. i, Alternative allele C at rs11663049 disrupts the motif of E2F5. The motif coordinate is shown on the top. j, TFi-eQTL analysis shows that rs11663049 modifies the regulatory role of E2F5 on CEP192 expression. The x-and y-axis represent normalised expression of E2F5 and CEP192, respectively. P-value from the interaction term in linear-mixed regression model.
Fig. 4
Fig. 4
Genetically regulatory heterogeneity between chondrocyte subtypes. a, Schematic overview of ci-eQTL analysis. For significant variant-gene pairs in cis-eQTL analysis, a linear-mixed model incorporating an interaction term between genotype dosage and cell type proportion was used to assess cell-type dependency of eQTL effects. The driver model indicates that the eQTL effect increases with the proportion of the specific cell type, while the non-driver model indicates that the eQTL effect diminishes as the cell type proportion increases. b. Chondrocyte subtype proportions predicted by CIBERSORTx per sample. Each column is a different sample. The y-axis shows the cumulative cell proportions. RegC, regulator chondrocyte; ProC, proliferation chondrocyte; HomC, homaeostasis chondrocyte; preHTC, prehypertrophic chondrocyte; EC, effector chondrocyte; FC, fibrocartilage chondrocyte; HTC, prehypertrophic chondrocyte; RepC, reparative chondrocyte; preFC, prefibrocartilage chondrocyte; preInfC, prefibrocartilage chondrocyte; and InfC, prefibrocartilage chondrocyte. c, Number of significant genes discovered in ci-eQTL analyses for the five chondrocyte subtypes, categorised into driver and non-driver models. d, Heatmap of mash results for all significant ci-eQTL interactions. Colour intensity represents the posterior effect size estimates of the interaction term between genotype dosage and cell type proportion as reported by mash. Red indicates the driver model, while blue indicates the non-driver model. Rows and columns were clustered based on similarity, with each column representing a variant-gene pair. e, Association between rs12948220 genotypes and TRPV3 expression. The y-axis shows normalised TRPV3 expression; the x-axis shows rs12948220 genotype. The whiskers extend to the 5th and 95th percentiles. The P-value was reported by FastQTL nominal procedure. f, ci-eQTL results of rs12948220∼TRPV3 pair across five chondrocyte subtypes. The y-axis shows normalised TRPV3 expression; the x-axis shows cell proportion. Each point represents a sample, colour -coded by genotype. The P-values indicate the statistical significance of interaction term in the linear-mixed regression model, and LFSR values was estimated by mash.
Fig. 5
Fig. 5
Co-localization analysis identifies osteoarthritis risk genes. a, Co-localization of OA GWAS loci with cartilage eQTLs. The numbers next to the triangles represent the highest value of posterior probability of a shared variant for both GWAS and eQTL signal (PP4) for each tissue site (see more details in Supplementary Tables S11 and S12). Genes with PP4 ≥ 0.7 in at least one GWAS data are shown. b, Heatmap showing whether OA risk loci effector genes identified from our eQTL data could also be identified by GTEx eQTL datasets or previous cartilage eQTL datasets. c, Functional annotation of co-localized genes based on multiple lines of evidence.
Fig. 6
Fig. 6
SLC44A2 regulation by OA risk variant rs3810154 via altering chromatin accessibility. a, Co-localization of OA GWAS locus and SLC44A2 eQTL. The y-axis shows the statistical significance of OA GWAS and SLC44A2 eQTL (−log10(P-value)). The x-axis shows the chromosome coordinate. b, SLC44A2 expression at each time point during the chondrocyte differentiation. The y-axis shows the expression value measured by TPM; The x-axis shows the time point. Each time point has three biological replications; The data are shown as mean ± SD. c, Association between rs3810154 genotypes and SLC44A2 expression. The y-axis shows normalised SLC44A2 expression; the x-axis shows rs3810154 genotypes. The whiskers extend to the 5th and 95th percentiles; The P-value was reported by FastQTL nominal procedure. d, rs3810154 is located within an open chromatin region downstream of SLC44A2 and affects local chromatin accessibility, with G allele reads showing higher peak intensity than A allele reads.
Fig. 7
Fig. 7
PIK3R1 regulation by OA risk variant rs11750646 via affecting AR binding. a, Co-localization of OA GWAS locus and PIK3R1 eQTL. The y-axis shows the statistical significance of OA GWAS and PIK3R1 eQTL (−log10(P-value)). The x-axis shows the chromosome coordinate. b, Association between the rs11750646 genotypes and PIK3R1 expression. The y-axis shows normalised PIK3R1 expression; the x-axis shows rs11750646 genotypes. The whiskers extend to the 5th and 95th percentiles. The P-value was reported by FastQTL nominal procedure. c, rs11750646 overlaps an AR footprint in an open chromatin downstream of PIK3R1. d, Reference allele C at rs11750646 disrupts the AR motif. Motif ID and coordinate are shown on the top. e, TFi-eQTL analysis shows that rs11750646 modifies the regulatory role of AR on PIK3R1 expression. The x-axis and y-axis represent normalised expression of AR and PIK3R1, respectively. The P-value indicates the statistical significance of interaction term in linear-mixed regression model. f, Schematic of the dual luciferase reporter vectors. The “PIK3R1-promoter-only” construct contains only the core promoter region of PIK3R1 and does not include the genomic region harbouring rs11750646 locus. g, Dual luciferase validation of open chromatin regions containing different alleles of rs11750646 in SW1353 cells. Luciferase signal is computed as the ratio of firefly luciferase activity to Renilla signal and relative activity are normalised by pGL3-PIK3R1-promoter. Four biological replicates for each group. P-values were calculated using two-tailed Student’s t-test. h, Allele-specific ChIP-qPCR indicated allele-specific binding of AR binding at rs11750646 in SW1353. Primers specifically targeting rs11750646-C or T were used. i, Expression of PIK3R1 in response to the knockdown of AR. GAPDH was used as a loading control. Four biological replicates for each group. P-values were calculated using two-tailed Student’s t-test. j, Dual luciferase validation of open chromatin regions containing different alleles of rs11750646 in response to the AR knockdown in SW1353 cells. The shRNA-NC is used as the negative control. Luciferase signals are normalised to Renilla signals. Four biological replicates for each group. P-values were calculated using two-tailed Student’s t-test. k, Schematic showing that the OA risk allele C of rs11750646 disrupts binding of AR to a regulatory element, resulting in decreased PIK3R1 expression and further increasing the risk of OA.

Similar articles

Cited by

References

    1. Long H., Liu Q., Yin H., et al. Prevalence trends of site-specific osteoarthritis from 1990 to 2019: findings from the global burden of disease study 2019. Arthritis Rheumatol. 2022;74(7):1172–1183. - PMC - PubMed
    1. Hunter D.J., Bierma-Zeinstra S. Osteoarthritis. Lancet. 2019;393(10182):1745–1759. - PubMed
    1. Warner S.C., Valdes A.M. The genetics of osteoarthritis: a review. J Funct Morphol Kinesiol. 2016;1(1):140–153.
    1. Cibrián Uhalte E., Wilkinson J.M., Southam L., Zeggini E. Pathways to understanding the genomic aetiology of osteoarthritis. Hum Mol Genet. 2017;26(R2):R193–R201. - PMC - PubMed
    1. Zengini E., Hatzikotoulas K., Tachmazidou I., et al. Genome-wide analyses using UK Biobank data provide insights into the genetic architecture of osteoarthritis. Nat Genet. 2018;50(4):549–558. - PMC - PubMed

Substances