. 2025 Jun 26;188(13):3389-3404.e6.
doi: 10.1016/j.cell.2025.04.027.

50,000 years of evolutionary history of India: Impact on health and disease variation

Affiliations

50,000 years of evolutionary history of India: Impact on health and disease variation

Elise Kerdoncuff et al. Cell. .

Abstract

India has been underrepresented in genomic surveys. We generated whole-genome sequences from 2,762 individuals in India, capturing the genetic diversity across most geographic regions, linguistic groups, and historically underrepresented communities. We find most Indians harbor ancestry primarily from three ancestral groups: South Asian hunter-gatherers, Eurasian Steppe pastoralists, and Neolithic farmers related to Iranian and Central Asian cultures. The extensive homozygosity and identity-by-descent sharing among individuals reflects strong founder events due to a recent shift toward endogamy. We uncover that most of the genetic variation in Indians stems from a single major migration out of Africa that occurred around 50,000 years ago, followed by 1%-2% gene flow from Neanderthals and Denisovans. Notably, Indians exhibit the largest variation and possess the highest amount of population-specific Neanderthal ancestry segments among worldwide groups. Finally, we discuss how this complex evolutionary history has shaped the functional and disease variation on the subcontinent.

Keywords: Denisovan ancestry; Neanderthal ancestry; South Asian evolutionary history; adaptation; ancient gene flow; disease susceptibility; founder events; functional variation; genomic diversity in India; peopling of India.


Conflict of interest statement

Declaration of interests The authors declare no competing interests.

Figures

Figure 1
Figure 1. Population structure and admixture in India.
(A) Sampling locations of LASI-DAD individuals in India, colored by region (North, North-east, Central, South, East and West) used for analysis. (B) Principal component analysis (PCA) for Indians in LASI-DAD and 1000G individuals of West Eurasian (EUR), East Asian (EAS) and South Asian (SAS) ancestry. We show the projection of the first two principal components, colored by region of birth. We find similar results with West Eurasian and East Asians populations from HGDP (Figure S4.5) (C) Ancestry proportions for each individual on the ‘Indian cline’ using Sarazm_EN (in orange) as a proxy for Iranian farmer-related, Central_Steppe_MLBA (in green) as a proxy for Steppe pastoralist-related and AHG (Onge) (in blue) as a proxy for AASI-related ancestry. Ancestry proportions are compared by region (left), language family (middle), and social group (right) of each individual. Boxplot box limits represent the 25th and 75th percentiles; the center line, the median and whiskers, the minimum/maximum value in the data or the 25th/75th percentile + 1.5x interquartile range.
Figure 2
Figure 2. Founder events and consanguinity leads to high rates of homozygosity and relatedness in Indians.
(A) Genome-wide homozygosity in LASI-DAD samples by region, compared to 1000G individuals from East Asia, Europe, and South Asia. Black lines show homozygous segments >8 cM, colored lines include shorter segments. (B) For each individual in LASI-DAD and 1000G, we identified the “closest related individual” as the individual who shares the highest total amount of identity-by-descent (IBD) segments, measured in centimorgans (cM). The Y-axis shows the percentage of individuals sharing ≥ x cM (X-axis). For LASI-DAD individuals, we inferred the mean and the standard error by resampling 500 individuals (dashed lines represent the mean and 95% CI). The vertical dashed lines indicate the expected value of the total IBD sharing for kth degree cousins. This figure was adapted from .
Figure 3
Figure 3. Archaic gene flow in India and worldwide populations.
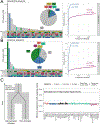
Upset plot and cumulative amount of archaic ancestry sequences (in Gb) in modern humans for (A) Neanderthal and (B) Denisovan ancestries. For comparison with deCODE, we used the stringent posterior probability cutoff (>0.9) and removed any SNPs in repetitive regions, (C) Each dot represents the minimum coalescence time with Sub-Saharan Africans estimated by using the emission parameters of the modern human state in hmmix. The X-axis shows each population colored by the region, and the gray area marks the 95% CI of the coalescence time of that population to sub-Saharan Africans. The dotted line represents the time of the Toba eruption (74,000 years ago) reflective of the minimum estimate of the Southern Dispersal out of Africa.
Figure 4
Figure 4. Impact of demographic history on disease risk.
(A) Relationship between the number of homozygous derived missense/pLoFs and the ancestry coefficient for individuals on the Indian cline. The y-axis is truncated to better illustrate the trends. (B) Relationship between the number of homozygous derived missense/pLoFs and the total sum of HBD segments per individual. Individuals are colored in function of their AHG-related ancestry coefficient, individuals not on the cline are in grey. We fit a regression using generalized linear model (glm) and obtain the following fit: y = 2576 + 0.916*x. (C) Distribution of archaic ancestry regions across the genome. We computed the mean archaic frequency along the genome of LASI-DAD individuals and considered segments with an archaic frequency higher than the mean (μ) + two standard deviations (σ) as enriched (blue for Neanderthal, green for Denisovan). Archaic ancestry deserts (<0.1% archaic ancestry over 10 Mb) are shown as striped rectangles in the same colors.

References

    1. Mastana SS (2014). Unity in diversity: an overview of the genomic anthropology of India. Ann. Hum. Biol. 41, 287–299. 10.3109/03014460.2014.922615. - DOI - PubMed
    1. Auton A, Brooks LD, Durbin RM, Garrison EP, Kang HM, Korbel JO, Marchini JL, McCarthy S, McVean GA, et al. ; 1000 Genomes Project Consortium (2015). A global reference for human genetic variation. Nature 526, 68–74. 10.1038/nature15393. - DOI - PMC - PubMed
    1. Bycroft C, Freeman C, Petkova D, Band G, Elliott LT, Sharp K, Motyer A, Vukcevic D, Delaneau O, O’Connell J, et al. (2018). The UK Biobank resource with deep phenotyping and genomic data. Nature 562, 203–209. 10.1038/s41586-018-0579-z. - DOI - PMC - PubMed
    1. Taliun D, Harris DN, Kessler MD, Carlson J, Szpiech ZA, Torres R, Taliun SAG, Corvelo A, Gogarten SM, Kang HM, et al. (2021). Sequencing of 53,831 diverse genomes from the NHLBI TOPMed Program. Nature 590, 290–299. 10.1038/s41586-021-03205-y. - DOI - PMC - PubMed
    1. Mallick S, Li H, Lipson M, Mathieson I, Gymrek M, Racimo F, Zhao M, Chennagiri N, Nordenfelt S, Tandon A, et al. (2016). The Simons Genome Diversity Project: 300 genomes from 142 diverse populations. Nature 538, 201–206. 10.1038/nature18964. - DOI - PMC - PubMed

Publication types

LinkOut - more resources