. 2025 Sep:99:102196.
doi: 10.1016/j.molmet.2025.102196. Epub 2025 Jun 26.

Adropin expression reflects circadian, lipoprotein, and mitochondrial processes in human tissues

Collaborators, Affiliations

Adropin expression reflects circadian, lipoprotein, and mitochondrial processes in human tissues

Joseph R Stevens et al. Mol Metab. 2025 Sep.

Abstract

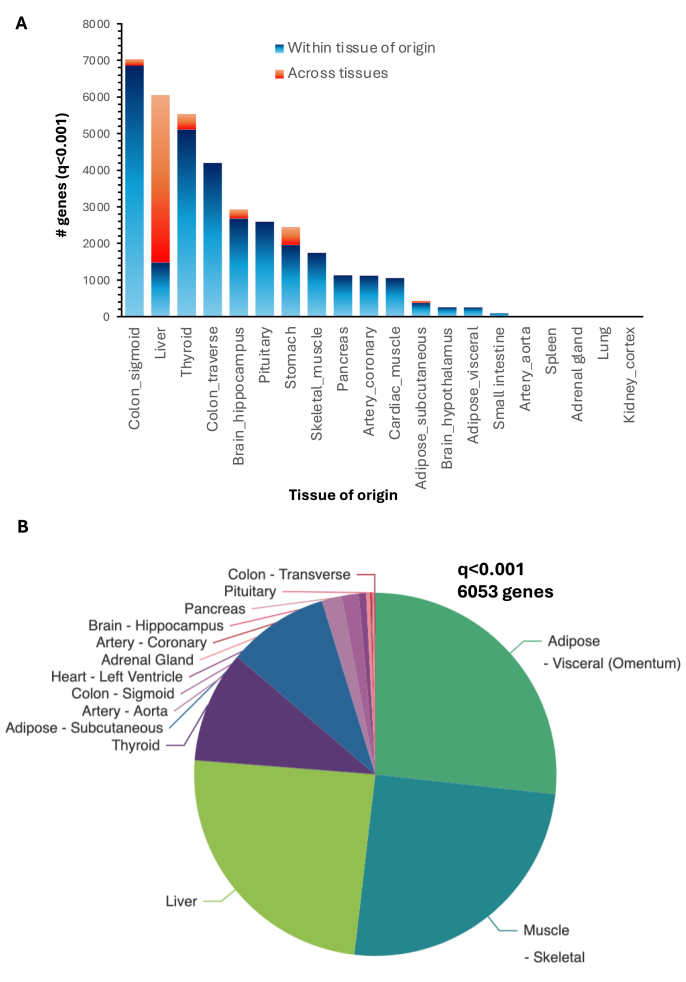
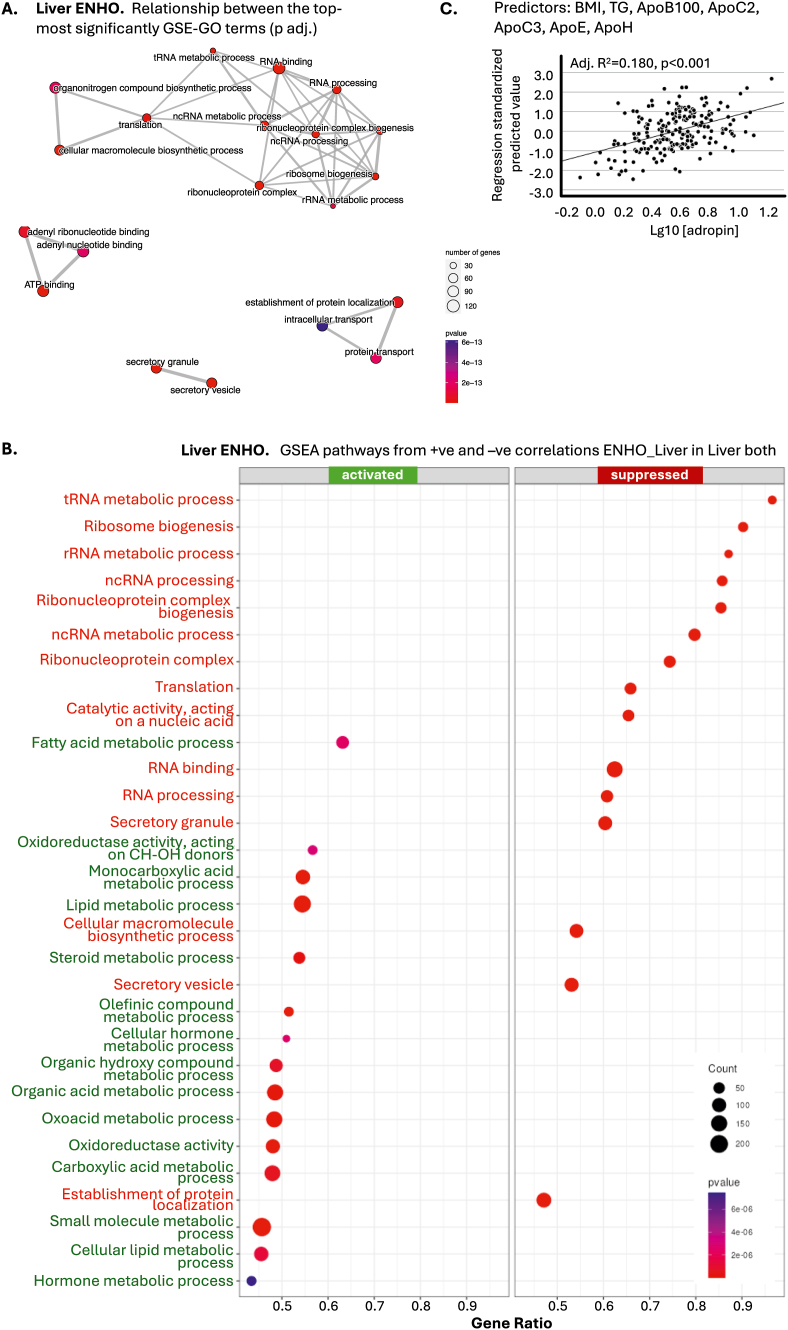
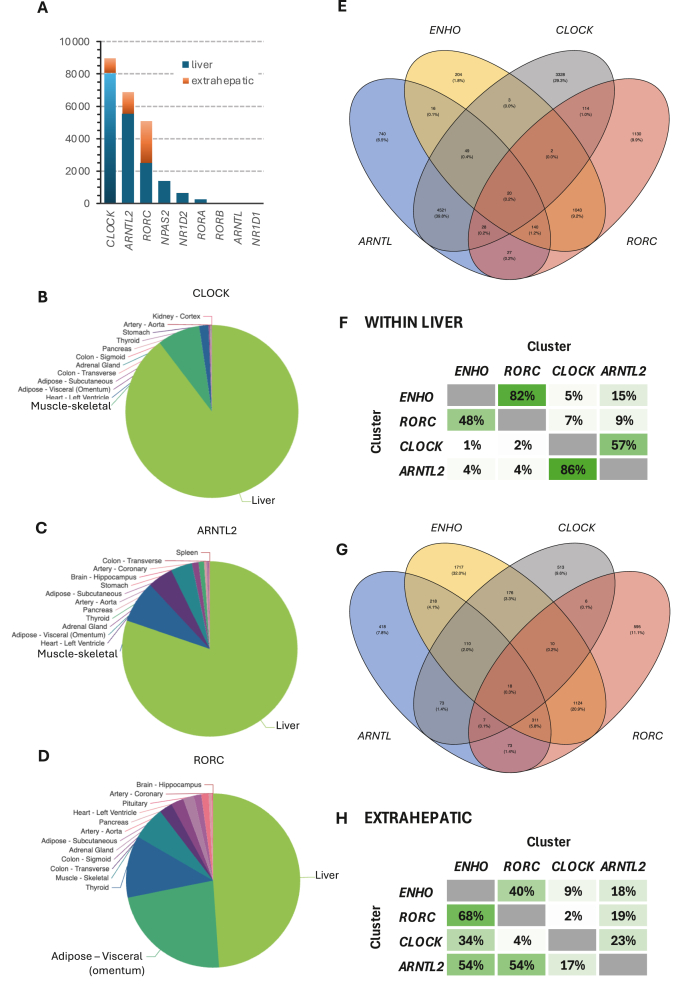
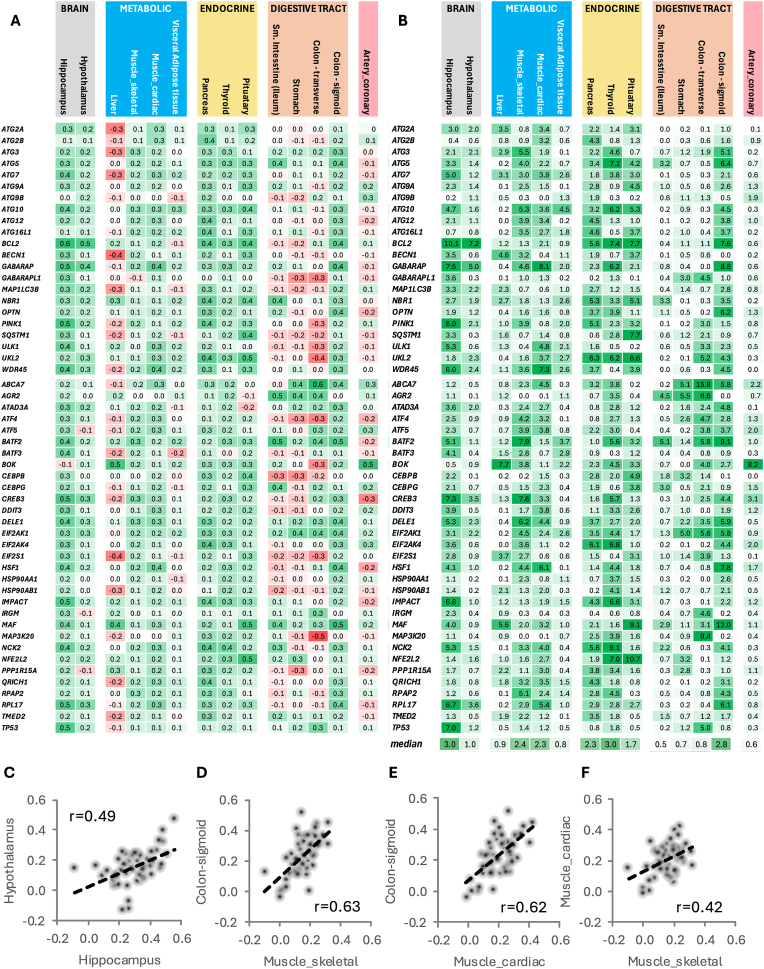
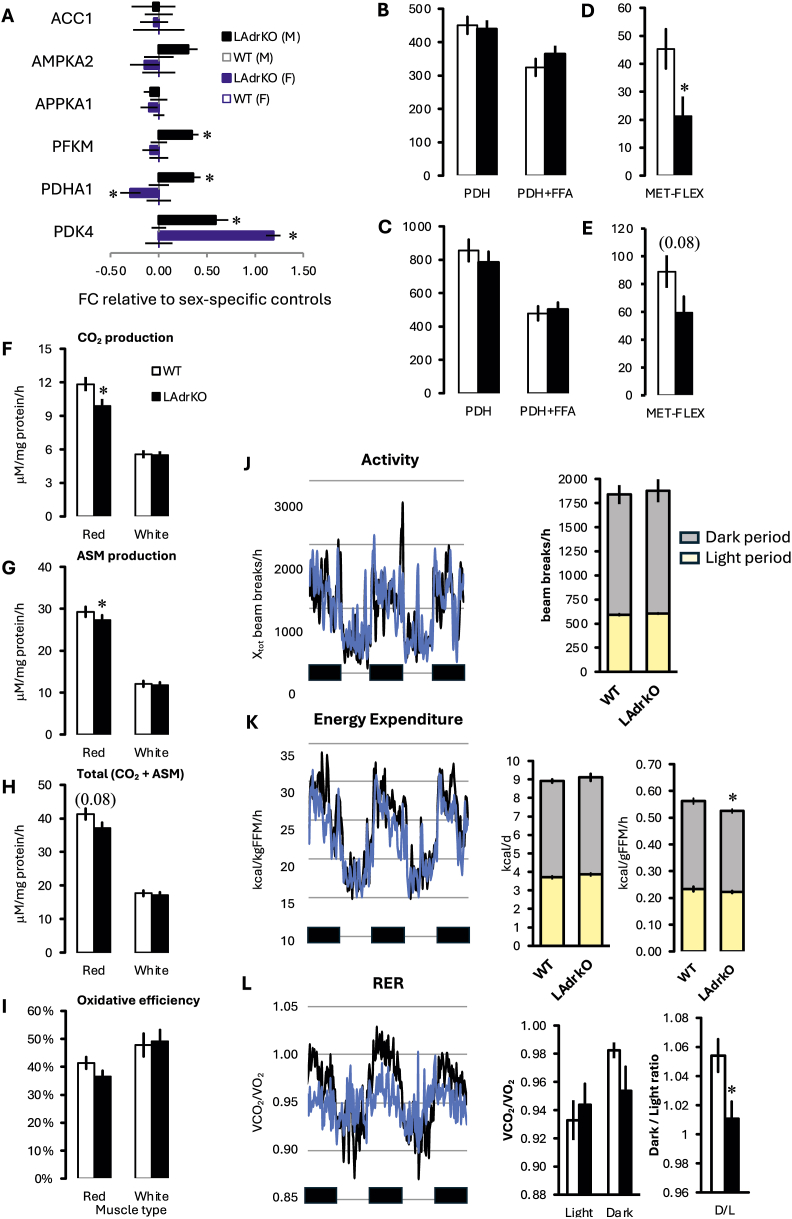
The clinical significance of interindividual variation in circulating adropin levels is unclear. To better understand adropin biology at the whole-body level, we surveyed transcriptional structures co-regulated with the Energy Homeostasis Associated (ENHO) gene encoding adropin across human tissues using Gene-Derived Correlations Across Tissues (GD-CAT). ENHO/adropin-related transcriptional structures with >1000 genes meeting the selection threshold (q < 0.001) occurred in 11/20 tissues. While most reflect local relationships, liver ENHO/adropin-related structures are dominated by transcripts expressed across metabolic tissues (skeletal muscle, adipose tissues, thyroid). Relationships between liver ENHO/adropin expression and skeletal muscle mitochondrial function were corroborated using liver-specific knockout mice. Within-liver ENHO/adropin transcriptional structures reflect lipoprotein metabolism (e.g., APOC1, p = 4.91 x 10⁻¹¹; APOA1, p = 8.03 x 10⁻⁹), confirmed by correlations between plasma concentrations of adropin and indices of lipoprotein metabolism in MAPT samples. Moreover, statin treatment which increases hepatic cholesterol efflux, reduces plasma adropin levels. The ENHO gene contains retinoic acid receptor-related orphan receptor response elements (RORE), suggesting circadian control. Pan-organ transcriptional structures with liver ENHO/adropin or RORC overlap, reflecting the liver clock. Strong, local relationships between ENHO/adropin and circadian genes were also observed in most non-hepatic tissues. ENHO/adropin expression widely reflects activation of oxidative metabolic pathways and suppression of ribosomal functions and cell division. Finally, hippocampal ENHO/adropin expression correlates strongly with Alzheimer's disease risk genes identified by GWAS. In summary, activation of ENHO/adropin expression reflects cellular circadian and mitochondrial oxidative processes, but with inhibition of anabolic processes. Plasma adropin concentrations may thus reflect hepatic lipoprotein production and activation of metabolic stress responses across human tissues.


Conflict of interest statement

Declaration of competing interest The authors declare the following financial interests/personal relationships which may be considered as potential competing interests: Andrew Butler reports financial support was provided by National Institutes of Health. Andrew Nguyen reports financial support was provided by National Institutes of Health. Marcus Seldin reports was provided by National Institutes of Health. Bruno Vellas reports was provided by French National Research Agency. Andrew Butler has patent #U.S. Patent no, 11/969,460, METHODS AND COMPOSITIONS FOR TREATING DECREASED COGNITIVE ABILITY issued to Saint Louis University. Nothing to declare If there are other authors, they declare that they have no known competing financial interests or personal relationships that could have appeared to influence the work reported in this paper.

Figures

Image 1
Graphical abstract
Figure 1
Figure 1
Genes within and across the major metabolic tissues of 310 individuals that correlate with ENHO expression with a q-value cut-off of q<0.001 suggest a liver-centric architecture. At this q-value cutoff threshold, only the liver shows strong cross-tissue relationships (A). A pie-chart is used to show the distribution of the liver-centered pan-organ transcription structure across tissues (B). These analyses used 310 individuals (across both sexes, 32% female, aged from 20 to 79y) with q-value adjustments calculated using a Benjamini-Hochberg FDR adjustment.
Figure 2
Figure 2
GSEA activated and suppressed pathways for paired ENHO-gene correlations within liver tissue samples identify relationships with hepatic lipid and RNA metabolism. Shown are the top-within tissue pathways (A) and pathways which are activated or suppressed in conditions where ENHO expression is increased (B). In panel B, text color identifies pathways co-activated (green) or suppressed (red) with ENHO expression. (C) Observed plasma adropin concentration values (x-axis) plotted against values predicted using a stepwise linear regression analysis parameters shown in Table 2. The predictors used are also listed to the right of the plot. (For interpretation of the references to color in this figure legend, the reader is referred to the Web version of this article.)
Figure 3
Figure 3
Within tissue of origin analysis showing correlations between ENHO and core clock/clock output genes, sirtuin genes, and genes encoding LXR-RXR heterodimers. (A) Heat maps with adjusted bicor values for paired relationships between ENHO and genes encoding the positive and negative arms of the core circadian clock, clock output genes (“circadian rhythm”), SIRT1-7 (“sirtuins”), and LXR/RXR genes (“LXR”). Positive and negative relationships are indicated by the color (green for positive correlations suggesting activation, red for negative suggesting suppression). (B) Heat map showing -log q-value. In panel B, the median q-values are shown for each gene. (For interpretation of the references to color in this figure legend, the reader is referred to the Web version of this article.)
Figure 4
Figure 4
Overlap of the ENHO and RORC containing transcriptional structures. (A) Number of genes that meet the q < 0.001 selection threshold against core clock genes using liver as the tissue of origin. (B–D) Pie charts showing the distribution of genes across tissues for CLOCK, ARNTL2, and RORC. (E, F) Overlap in genes expressed in the liver that meet the q < 0.001 selection threshold for ARNTL, ENHO, CLOCK, and RORC. The table should be read left to right. For example, 82% of genes that meet the selection threshold for liver ENHO also meet the selection threshold for liver RORC; 48% of genes that meet the selection threshold for RORC also meet the selection threshold for ENHO. In this comparison, there is evidence for overlapping transcriptional structures for ENHO and RORC, and for CLOCK and ARNTL2. (G, H) Overlap in genes expressed in non-hepatic tissues that meet the q < 0.001 selection threshold for liver-expressed ARNTL2, ENHO, CLOCK, and RORC. In this case, 40% of genes expressed outside the liver that meet the selection threshold for ENHO expressed within the liver also meet the selection threshold for RORC expressed in liver. On the other hand, 68% of genes expressed outside the liver that meet the selection threshold for RORC in the liver also meet the selection threshold for ENHO expressed in the liver. There is also evidence of overlap between the genes expressed outside the liver that meet the threshold for CLOCK and ARNTL2 in the liver with liver-expressed ENHO. The extra-hepatic ENHO-related pan-organ structure thus appears to be more correlated to liver-expressed genes expressing the core circadian oscillators.
Figure 5
Figure 5
Mediation indicates that ENHO and RORC expressed in liver are part of a common transcriptional structure that influences hepatic lipid metabolism genes (A, B) and skeletal muscle mitochondrial genes (C, D). Using RORC as a covariate in the analysis significantly weakens the relationships, suggesting co-regulation.
Figure 6
Figure 6
Relationships between the expression of ENHO and genes involves in glucose or fatty acid oxidation (A, B) and regulation of ENHO expression in HepG2 cells by H2O2. (A) Heat maps with adjusted bicor values for paired relationships between ENHO and selected genes. Positive and negative relationships are indicated by the color (green for positive, red for negative). (B) Heat map showing the log q-value. The mean q-values are shown for each gene; genes showing strong correlations with ENHO in all tissues are highlighted using an asterisk. (C, D) Effect of H2O2 treatment on ENHO expression in HepG2 cells. Data are shown for an experiment that compares responses in the presence or absence of fetal bovine serum (C), or in response to increasing doses (D). (E) The impact of H2O2 on the expression of ENHO and DDIT3 is strongly correlated. (For interpretation of the references to color in this figure legend, the reader is referred to the Web version of this article.)
Figure 7
Figure 7
Relationships between activation of ENHO expression and genes driving integrated stress responses. (A) Heat maps with adjusted bicor values for paired relationships between ENHO and genes encoding proteins involved in autophagy and ISR. Positive and negative relationships are indicated by the color (green for positive correlations suggesting activation, red for negative suggesting suppression). (B) Heat map showing -log q-value. In panel B, the median q-values are shown for each gene and for each tissue. (C) Relationships between ENHO-paired gene correlations in the hippocampus and hypothalamus. (D) Relationships between ENHO-paired gene correlations in skeletal muscle and sigmoid colon. (E) Relationships between ENHO-paired gene correlations in cardiac muscle (left ventricle of the heart) and sigmoid colon. (F) Relationships between ENHO-paired gene correlations in skeletal muscle and cardiac muscle (left ventricle of the heart). The data shown in panels D and E suggest a relationship between stress responses in muscle groups and sigmoid colon. (For interpretation of the references to color in this figure legend, the reader is referred to the Web version of this article.)
Figure 8
Figure 8
Targeted deletion of the mouse Enho gene in liver disrupts mitochondrial processes in skeletal muscle. (A) Analysis of genes involved in fuel metabolism in muscle of liver-specific adropin knockouts (LAdrKO) and controls. ∗p < 0.05 within sex. (B–C) Activity of the pyruvate dehydrogenase complex (PDH) in the absence or presence of free-fatty acid (FFA) in oxidative (B) and glycolytic (C) fibers. The suppression of PDH activity by FFA, an indicator of metabolic flexibility, is impaired in LAdRKO. (F–I) Analysis of fatty acid oxidation in oxidative (red) and glycolytic (white) muscle. (J–L) Analysis of physical activity, whole-body energy expenditure and fuel selection in LAdrKO. Physical activity is not significantly different between genotypes (J). LAdrKO exhibit reduced energy expenditure adjusted for fat-free (lean) mass in the dark period (K). Daily rhythms of fuel selection, indicated by changes in the respiratory exchange ratio (RER), are impaired in LAdrKO (L). (For interpretation of the references to color in this figure legend, the reader is referred to the Web version of this article.)

References

    1. Kumar K.G., Trevaskis J.L., Lam D.D., Sutton G.M., Koza R.A., Chouljenko V.N., et al. Identification of adropin as a secreted factor linking dietary macronutrient intake with energy homeostasis and lipid metabolism. Cell Metab. 2008;8(6):468–481. - PMC - PubMed
    1. Ganesh Kumar K., Zhang J., Gao S., Rossi J., McGuinness O.P., Halem H.H., et al. Adropin deficiency is associated with increased adiposity and insulin resistance. Obesity. 2012;20(7):1394–1402. - PMC - PubMed
    1. Banerjee S., Ghoshal S., Stevens J.R., McCommis K.S., Gao S., Castro-Sepulveda M., et al. Hepatocyte expression of the micropeptide adropin regulates the liver fasting response and is enhanced by caloric restriction. J Biol Chem. 2020;295(40):13753–13768. - PMC - PubMed
    1. Chen X., Chen S., Shen T., Yang W., Chen Q., Zhang P., et al. Adropin regulates hepatic glucose production via PP2A/AMPK pathway in insulin-resistant hepatocytes. FASEB J. 2020;34(8):10056–10072. - PubMed
    1. Chen X., Xue H., Fang W., Chen K., Chen S., Yang W., et al. Adropin protects against liver injury in nonalcoholic steatohepatitis via the Nrf2 mediated antioxidant capacity. Redox Biol. 2019;21 - PMC - PubMed

LinkOut - more resources