. 2025 Jun 27;15(1):20331.
doi: 10.1038/s41598-025-07167-3.

Circular RNA circIGF1R controls cardiac fibroblast proliferation through regulation of carbohydrate metabolism

Affiliations

Circular RNA circIGF1R controls cardiac fibroblast proliferation through regulation of carbohydrate metabolism

Arne Schmidt et al. Sci Rep. .

Abstract

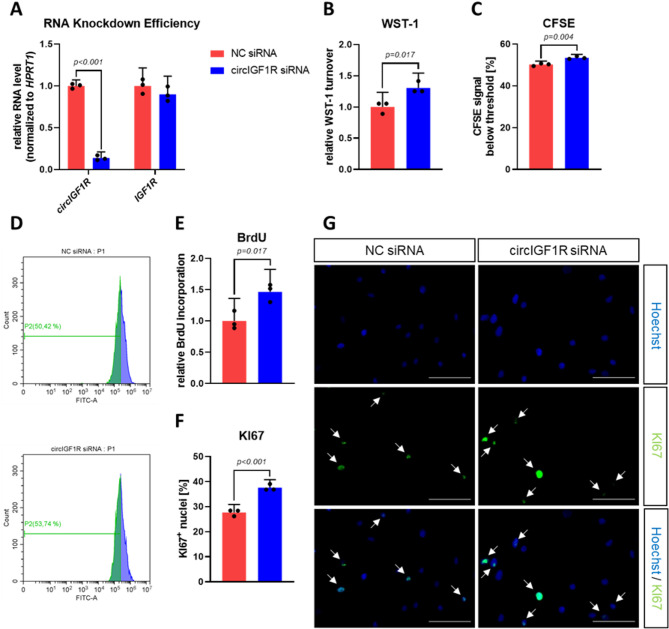
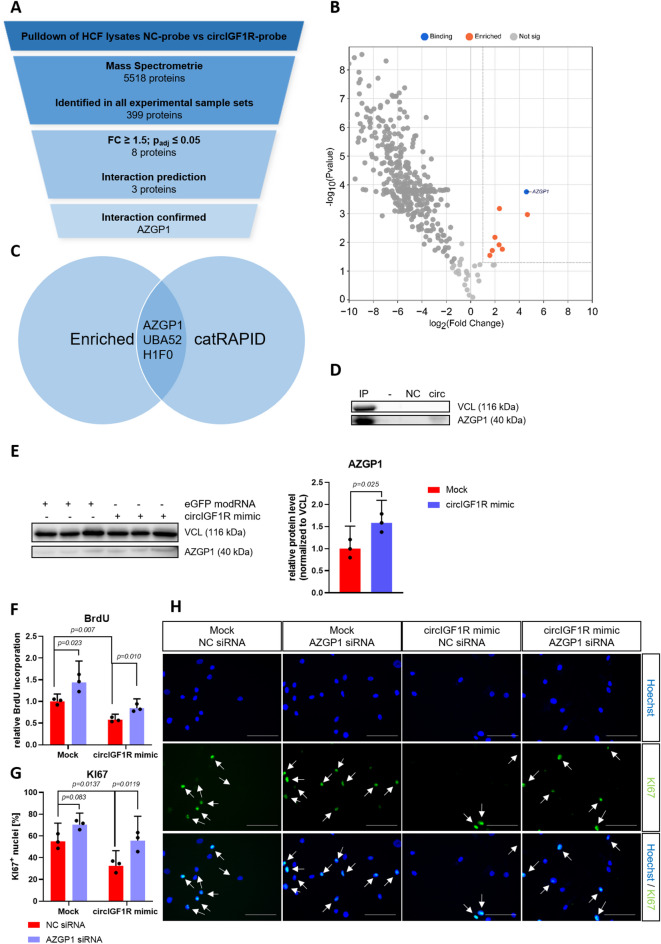
Excessive fibroblast proliferation and metabolic reprogramming are hallmarks of pathological cardiac remodeling, contributing significantly to impaired cardiac function. This study investigates the role of circular RNAs (circRNAs) in fibroblast metabolic reprogramming, an unexplored area with potential therapeutic implications. Through deep circRNA sequencing of cardiac tissue from heart failure (HF) patients and healthy individuals, we identified circIGF1R (hsa_circ_0005035), which exhibited dysregulation specifically in isolated cardiac fibroblasts derived from failing hearts. Silencing circIGF1R in patient-derived human cardiac fibroblasts (HCFs) led to accelerated proliferation, enhanced glycolytic activity, altered glucose trafficking, and increased glucose import. Conversely, administering recombinant circIGF1R inhibited the accelerated proliferation and enhanced glycolytic activity observed in HCFs from HF patients. Mechanistically, RNA pulldown assays and in silico analyses identified AZGP1 as a potential interaction partner facilitating the glycolysis-inhibitory and anti-proliferative functions of circIGF1R. Our findings identify circIGF1R as a pivotal regulator of fibroblast proliferation via metabolic reprogramming, particularly by glycolysis inhibition. Overexpression of circIGF1R demonstrated significant anti-fibrotic effects in cardiac fibroblasts derived from heart failure patients. These results underscore the therapeutic potential of circIGF1R in attenuating cardiac fibrosis by directly targeting fibroblast metabolism in the context of pathological cardiac remodeling.

Keywords: Cardiac fibroblast; Cardiac fibrosis; Cardiac metabolism; Circular RNA; Glycolysis; Heart failure; Proliferation.


Conflict of interest statement

Declarations. Competing interests: The authors declare no competing interests. Ethics approval and consent to participate: The mice used in this study were purchased from Charles River. All animal experiments were approved by the authorities at Hannover Medical School and the Niedersächsische Landesamt für Verbraucherschutz und Lebensmittelsicherheit (LAVES). This study is performed in accordance with relevant guidelines and regulations. All methods are reported in accordance with ARRIVE guidelines. Ethical approval for the use of patient samples in this research was granted by the institutional ethics committee of the Hannover Medical School, Germany (number 9398_BO_K_2020). The study was conducted according to the guidelines from the declaration of Helsinki and its amendments or comparable ethical standards. Data collection of the patient samples including written informed consent was obtained.The ethics committee of the Hannover Medical School permitted and approved isolation of HCFs from patient’s biomaterial. Consent for publication: All authors have agreed to publish this manuscript.

Figures

Fig. 1
Fig. 1
RNA sequencing identifies circIGF1R as a potential regulator of HF-progression. (A) Filtering strategy to identify circRNAs involved in HF progression by RNA sequencing of human HF biopsies against healthy controls (n = 5). (B) Volcano Plot of the circRNA sequencing dataset from human HF biopsies against healthy controls (n = 5). Cutoffs (dashed lines) were set at padj ≤ 0.05 and FC ≥ 2. (C) Agarose gel electrophoresis of the circIGF1R PCR product created with divergent primers. M: QuickLoad® 100 bp DNA Ladder; 1: HCF cDNA; 2: HCF gDNA; 3: NTC. (D) Sanger sequencing of the isolated PCR product using divergent primers from HCF cDNA. Dashed line indicates the BSJ of circIGF1R. (E) qRT-PCR of circIGF1R, IGF1R, GAPDH, GUSB and HPRT1 in cDNA reverse transcribed from RNase R-digested HCF RNA (n = 3). Data are depicted as percentage and normalized to undigested control group. Analyzed via unpaired t-test. (F) qRT-PCR of circIGF1R and IGF1R in HCFs after actinomycin D treatment. Data are depicted as fold change and normalized to expression levels at 0 h. Representative n = 1 experiment from n = 3 shown.
Fig. 2
Fig. 2
circIGF1R is dysregulated in HF-associated cardiac fibroblasts. (A) qRT-PCR of circIgf1r in adult mouse whole heart tissue after TAC surgery (n = 5). RNA levels of circIgf1r were normalized to TATA-box binding protein (Tbp). Data are depicted as fold change and normalized to sham group. Analyzed via unpaired t-test. (B) qRT-PCR of circIgf1r in isolated adult mouse cardiomyocytes (CM), cardiac fibroblasts (CF) and cardiac endothelial cells (EC) after TAC surgery (n = 4/5). RNA levels of circIgf1r were normalized to Tbp. Data are depicted as fold change and normalized to sham group. Analyzed via matched 2-way ANOVA with Sidak’s and Tukey’s post-hoc correction. (C) qRT-PCR of circIGF1R in HF HCFs compared to non-HF HCFs (n = 3). RNA levels of circIGF1R were normalized to GAPDH. Data are depicted as fold change and normalized to non-HF HCF group. Analyzed via unpaired t-test. (D) RNA-FISH of circIGF1R in HCFs. Scale bar = 20 μm. White arrows indicate circIGF1R probe signal. α-SMA served as fibroblast cell markers and Hoechst 33342 as nuclear marker.
Fig. 3
Fig. 3
siRNA-mediated silencing of circIGF1R augments proliferation of cardiac fibroblasts. (A) qRT-PCR of circIGF1R and IGF1R in HCFs treated with NC siRNA or circIGF1R siRNA mix (n = 3). RNA levels of circIGF1R and IGF1R were normalized to HPRT1. Data are depicted as fold change and normalized to NC siRNA group. Analyzed via unpaired t-test. (B) WST-1 assay in HCFs treated with NC siRNA or circIGF1R siRNA mix (n = 3). Data are depicted as fold change and normalized to NC siRNA group. Analyzed via unpaired t-test. (C) CFSE flow cytometry in HCFs treated with NC siRNA or circIGF1R siRNA mix (n = 3). Analyzed via unpaired t-test. CFSE: carboxyfluorescein succinimidyl ester. (D) Representative histogram of CFSE flow cytometry in HCFs treated with NC siRNA or circIGF1R siRNA mix. (E) BrdU-ELISA in HCFs treated with NC siRNA or circIGF1R siRNA mix (n = 3). Data are depicted as fold change and normalized to NC siRNA group. Analyzed via unpaired t-test. (F) Ki67 immunofluorescence staining in HCFs treated with NC siRNA or circIGF1R siRNA mix (n = 3). Analyzed via unpaired t-test. (G) Representative images of Ki67 immunofluorescence staining in HCFs treated with NC siRNA or circIGF1R siRNA mix. White arrows indicate KI67+ nuclei. Scale bar = 100 μm.
Fig. 4
Fig. 4
circIGF1R-silencing enhances glycolytic activity of cardiac fibroblasts. (A) Representative Glycolytic Rate Assay time course of HCFs treated with NC siRNA or circIGF1R siRNA mix. Dashed lines indicate injection of corresponding compounds. glycoPER: glycolytic proton efflux rate; Rot: rotenone; AA: antimycin A; 2-DG: 2-deoxyglucose. (B) Basal PER, (C) basal glycolysis, (D) compensatory glycolysis and (E) mitoOCR/glycoPER were measured via Glycolytic Rate Assay in HCFs treated with NC siRNA or circIGF1R siRNA mix (n = 3). Analyzed via unpaired t-test. (F) Lactate secretion and (G) glucose uptake were measured in the supernatant of HCFs treated with NC siRNA or circIGF1R siRNA mix (n = 4). Analyzed via unpaired t-test. (H) M3 pyruvate, (I) M3 lactate, (J) M3 alanine, (K) M2 citrate, (L) M4 citrate, (M) M4/M2 citrate, (N) M3 malate and (O) M3 aspartate were measured via GC/MS in lysates of HCFs treated with NC siRNA or circIGF1R siRNA mix (n = 4). Analyzed via unpaired t-test.
Fig. 5
Fig. 5
circIGF1R mimics mitigate enhanced proliferation of HF-derived cardiac fibroblasts. (A) qRT-PCR of circIGF1R and IGF1R in non-HF and HF HCFs treated with mock or circIGF1R mimics (n = 4). RNA levels of circIGF1R and IGF1R were normalized to HPRT1. Data are depicted as fold change and normalized to mock group. Analyzed via unpaired t-test. (B) WST-1 assay in non-HF and HF HCFs treated with mock or circIGF1R mimics (n = 3). Data are depicted as fold change and normalized to non-HF mock group. Analyzed via 2-way ANOVA with Sidak’s post-hoc correction. (C) CFSE flow cytometry in non-HF and HF HCFs treated with mock or circIGF1R mimics (n = 3). Analyzed via 2-way ANOVA with Sidak’s post-hoc correction. (D) Representative histogram of CFSE flow cytometry in non-HF and HF HCFs treated with mock or circIGF1R mimics. (E) BrdU-ELISA in non-HF and HF HCFs treated with mock or circIGF1R mimics (n = 3). Data are depicted as fold change and normalized to non-HF mock group. Analyzed via 2-way ANOVA with Sidak’s post-hoc correction. (F) Ki67 immunofluorescence staining in non-HF and HF HCFs treated with mock or circIGF1R mimics (n = 3). Analyzed via 2-way ANOVA with Sidak’s post-hoc correction. (G) Representative images of Ki67 immunofluorescence staining in non-HF and HF HCFs treated with mock or circIGF1R mimics. White arrows indicate Ki67+ nuclei. Scale bar = 100 μm.
Fig. 6
Fig. 6
circIGF1R mimics attenuate increased glycolytic activity in HF-associated cardiac fibroblasts. (A) Representative Glycolytic Rate Assay time course of non-HF and HF HCFs treated with mock or circIGF1R mimics. Dashed lines indicate injection of corresponding compounds. (B) Basal glycolysis and (C) compensatory glycolysis were measured via a Glycolytic Rate Assay in non-HF and HF HCFs treated with mock or circIGF1R mimics (n = 3). Analyzed via 2-way ANOVA with Sidak’s post-hoc correction. (D) Lactate secretion and (E) glucose uptake were measured in supernatants of non-HF and HF HCFs treated with mock or circIGF1R mimics (n = 4). Analyzed via 2-way ANOVA with Sidak’s post-hoc correction. (F) M3 pyruvate, (G) M3 lactate, (H) M3 alanine, (I) M2 citrate, (J) M4 citrate, (K) M4/M2 citrate, (L) M3 malate and (M) M3 aspartate were measured via GC/MS in lysates of non-HF and HF HCFs treated with mock or circIGF1R mimics (n = 4). Analyzed via 2-way ANOVA with Sidak’s post-hoc correction.
Fig. 7
Fig. 7
RNA pulldown identifies multiple protein interaction partners of circIGF1R. (A) Filtering strategy to identify protein interaction partners of circIGF1R in non-HF-derived HCFs upon RNA pulldown with circIGF1R-specific probe NC probe (n = 4). (B) Volcano Plot of RNA pulldown experiments from lysates of non-HF-derived HCFs treated with circIGF1R-specific probe or NC probe (n = 4). Dashed lines indicate thresholds (FC ≥ 1.5; padj ≤ 0.05). (C) Venn diagram showing the overlapping proteins between in silico interaction prediction via catRAPID and significantly-enriched proteins. (D) Western Blot of non-HF-derived HCF lysates after RNA-pulldown with circIGF1R-specific probe or NC probe (n = 1). IP: Input; NC: NC probe; circ: circIGF1R probe. (E) Western Blot of HF-derived HCFs treated with mock or circIGF1R mimics including quantified protein levels (n = 3). VCL: Vinculin. (F) BrdU-ELISA in HF-HCFs transfected with either NC siRNA or AZGP1 siRNA, followed by treatment with mock or circIGF1R mimics (n = 3). Data are depicted as fold change and normalized to the cotreatment group receiving mock and NC siRNA. Analyzed via 2-way ANOVA with Sidak’s post-hoc correction. (G) Ki67 immunofluorescence staining in HF HCFs transfected with either NC siRNA or AZGP1 siRNA, followed by treatment with mock or circIGF1R mimics (n = 3). Analyzed via 2-way ANOVA with Sidak’s post-hoc correction. (H) Representative images of Ki67 immunofluorescence staining in HF HCFs transfected with either NC siRNA or AZGP1 siRNA, followed by treatment with mock or circIGF1R mimics. White arrows indicate Ki67+ nuclei. Scale bar = 100 μm.

References

    1. Khalil, H. et al. Fibroblast-specific TGF-beta-Smad2/3 signaling underlies cardiac fibrosis. J. Clin. Invest.127, 3770–3783 (2017). - PMC - PubMed
    1. Costa, A. et al. Neonatal injury models: integral tools to Decipher the molecular basis of cardiac regeneration. Basic. Res. Cardiol.117, 26 (2022). - PMC - PubMed
    1. Nagaraju, C. K. et al. Myofibroblast phenotype and reversibility of fibrosis in patients with End-Stage heart failure. J. Am. Coll. Cardiol.73, 2267–2282 (2019). - PubMed
    1. Sun, Y. W. et al. Pirfenidone prevents radiation-induced intestinal fibrosis in rats by inhibiting fibroblast proliferation and differentiation and suppressing the TGF-beta1/Smad/CTGF signaling pathway. Eur. J. Pharmacol.822, 199–206 (2018). - PubMed
    1. Lewis, G. A. et al. Pirfenidone in heart failure with preserved ejection fraction: a randomized phase 2 trial. Nat. Med.27, 1477–1482 (2021). - PubMed