. 2025 Jun 27;16(1):5360.
doi: 10.1038/s41467-025-60894-z.

Hepatitis B virus promotes liver cancer by modulating the immune response to environmental carcinogens

Affiliations

Hepatitis B virus promotes liver cancer by modulating the immune response to environmental carcinogens

Mei Huang et al. Nat Commun. .

Abstract

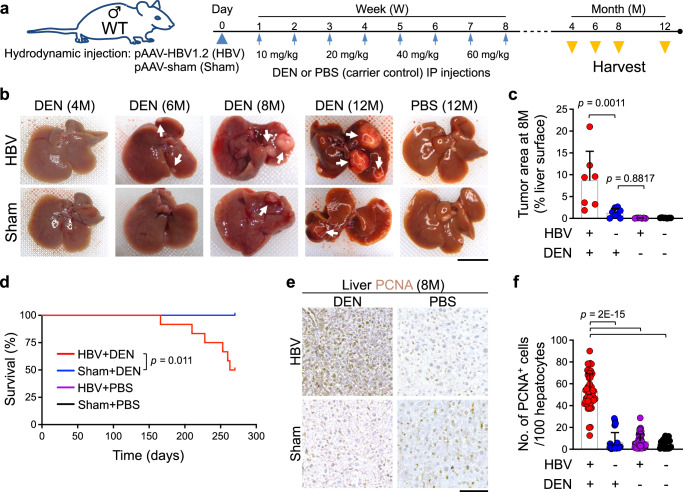
Hepatitis B virus (HBV) infection is associated with hepatitis and hepatocellular carcinoma (HCC). Considering that most HBV-infected individuals remain asymptomatic, the mechanism linking HBV to hepatitis and HCC remains uncertain. Herein, we demonstrate that HBV alone does not cause liver inflammation or cancer. Instead, HBV alters the chronic inflammation induced by chemical carcinogens to promote liver carcinogenesis. Long-term HBV genome expression in mouse liver increases liver inflammation and cancer propensity caused by a carcinogen, diethylnitrosamine (DEN). HBV plus DEN-activated interleukin-33 (IL-33)/regulatory T cell axis is required for liver carcinogenesis. Pitavastatin, an IL-33 inhibitor, suppresses HBV plus DEN-induced liver cancer. IL-33 is markedly elevated in HBV+ hepatitis patients, and pitavastatin use significantly correlates with reduced risk of hepatitis and its associated HCC in patients. Collectively, our findings reveal that environmental carcinogens are the link between HBV and HCC risk, creating a window of opportunity for cancer prevention in HBV carriers.


Conflict of interest statement

Competing interests: J.H.P. and S.D. are coinventors on a filed patent for the use of IL-33 inhibition in the treatment of cancer, fibrosis, and inflammation (PCT/US21/40725). Other authors state no conflict of interest.

Figures

Fig. 1
Fig. 1. HBV plus carcinogen promotes liver cancer development.
a The schematic diagram of liver carcinogenesis protocol. b Representative macroscopic images of the liver from WT mice that underwent liver carcinogenesis protocol at 4, 6, 8, and 12 months (M) post-infection. Arrows point to liver tumors. c Tumor burden measured as % liver surface area of WT mice that underwent liver carcinogenesis protocol at 8 months post-infection. n = 7 mice in HBV+DEN group, n = 8 mice in Sham+DEN group, n = 7 mice in HBV+PBS group, and n = 7 mice in Sham+PBS group. Each dot represents a mouse. Experimental data were verified in two independent experiments. d Survival of WT mice underwent liver carcinogenesis protocol. n = 12 mice in HBV+DEN group; n = 10 mice in Sham+DEN group, n = 16 mice in HBV+PBS group, and n = 10 mice in Sham+PBS group. Log-rank test. e Representative images of PCNA stained liver from WT mice that underwent liver carcinogenesis protocol at 8 months post-infection. f Quantification of PCNA+ hepatocytes in WT mice subjected to liver carcinogenesis protocol at 8 months post-infection. PCNA+ cells per 100 hepatocytes were counted in five to eight randomly selected high power field (HPF) images of each liver. Each dot represents an HPF image. Liver samples were from n = 6 mice in HBV+DEN group, n = 7 mice in Sham+DEN group, n = 7 mice in HBV+PBS group, and n = 4 mice in Sham+PBS group. Graphs show mean + SD, (c, f) one-way ANOVA with Tukey’s multiple comparison test, scale bars: 1 cm (liver images) and 100 μm (histology). Source data are provided as a Source Data file.
Fig. 2
Fig. 2. HBV plus carcinogen-induced liver cancer development is preceded by chronic inflammation and IL-33 induction in the liver.
a Representative images of CD45 stained liver tissues treated with carcinogenesis protocol at 4 months post-infection. b Quantification of CD45+ leukocytes in WT liver subjected to carcinogenesis protocol at 4 months post-infection. Each dot represents the average number of CD45+ cells per 10 randomly selected HPF images from each liver. Liver samples were from n = 8 mice in HBV+DEN group, n = 8 mice in Sham+DEN group, n = 12 mice in HBV+PBS group, and n = 10 mice in Sham+PBS group. c The enrichment plot of hepatitis gene set from differentially expressed gene list of HBV+DEN-treated liver compared with Sham+DEN-treated liver at 4 months post-infection. n = 3 mice in each group, Kolmogorov-Smirnov test. d Heatmap of differentially expressed interleukin genes between HBV+DEN- and Sham+DEN-treated liver at 4 months post-infection. e IL-33 protein levels in HBV+DEN- (n = 10 mice) versus Sham+DEN-treated liver (n = 9 mice) at 4 months post-infection. Each dot represents a mouse. f Representative images of IL-33 stained HBV+DEN- and Sham+DEN-treated liver at 4 months post-infection. g Quantification of IL-33high cells per 100 cells in the HBV+DEN (n = 8 mice) compared with Sham+DEN-treated liver (n = 6 mice) at 4 months post-infection. IL-33high cells per 100 cells were counted in five to eight randomly selected HPF images per liver. Each dot represents an HPF image. h Representative images of HMGB1 stained HBV+DEN- and Sham+DEN-treated liver at 4 months post-infection. i Quantification of HMGB1+ cells per 100 hepatocytes in the HBV+DEN (n = 5 mice) compared with Sham+DEN-treated liver (n = 7 mice) at 4 months post-infection. HMGB1+ cells per 100 hepatocytes were counted in five to eight randomly selected HPF images per liver. Each dot represents an HPF image. Graphs show mean + SD, (b) one-way ANOVA with Tukey’s multiple comparison test, (e, g, i) two-sided unpaired t-test, scale bar: 100 μm. Source data are provided as a Source Data file.
Fig. 3
Fig. 3. IL-33 cytokine signaling is required for HBV+DEN-induced liver cancer.
a Representative macroscopic images of Il33KO, ST2KO, Irf3KO, and WT liver treated with HBV+DEN at 8 months post-infection. Arrows point to liver tumors. b Tumor burden measured as % liver surface area of Il33KO (n = 7), ST2KO (n = 5), Irf3KO (n = 6), and WT mice (n = 7) that received HBV+DEN at 8 months post-infection. Each dot represents a mouse. Experimental data were verified in two independent experiments. c Representative images of PCNA stained Il33KO, ST2KO, Irf3KO, and WT liver treated with HBV+DEN at 8 months post-infection. d Quantification of PCNA+ hepatocytes in Il33KO (n = 4 mice), ST2KO (n = 7 mice), Irf3KO (n = 6 mice), and WT mice (n = 5 mice) that received HBV+DEN at 8 months post-infection. PCNA+ cells per 100 hepatocytes were counted in five to eight randomly selected HPF images of each liver. Each dot represents an HPF image. e Percent ST2+ immune cell types in Il33KO (n = 6) and WT liver (n = 4) treated with HBV+DEN at 4 months post-infection. Each dot represents a mouse. f Hepatic Treg frequency as % total CD4+ T cells in WT liver after incubation with IL-2 plus IL-33, IL-2, versus no cytokine treatment (PBS) control (n = 6). Each dot represents a mouse. g TGF-β1 mean fluorescence intensity (MFI) of IL-2 plus IL-33, IL-2, versus PBS-treated ST2+ Tregs (n = 6). Each dot represents a mouse. h IL-10 MFI of IL-2 plus IL-33, IL-2, versus PBS-treated ST2+ Tregs (n = 6). Each dot represents a mouse. Graphs show mean + SD, (b, d, fh) one-way ANOVA with Tukey’s multiple comparison test, (e) two-sided unpaired t-test, scale bars: 1 cm (liver images) and 100 μm (histology). Source data are provided as a Source Data file.
Fig. 4
Fig. 4. IL-33/Treg axis is essential for HBV+DEN-induced liver cancer.
a Representative macroscopic image of TregST2CKO and WT liver treated with HBV+DEN at 8 months post-infection. The arrow points to a liver tumor. b Tumor burden measured as % liver surface area of TregST2CKO (n = 12) and WT (n = 6) mice that received HBV+DEN at 8 months post-infection. Each dot represents a mouse. Experimental data were verified in two independent experiments. c Representative images of hematoxylin and eosin (H&E) stained TregST2CKO and WT liver treated with HBV+DEN at 8 months post-infection. d Representative images of PCNA stained TregST2CKO and WT liver treated with HBV+DEN at 8 months post-infection. e Quantification of PCNA+ hepatocytes in TregST2CKO (n = 8) and WT (n = 5) mice that received HBV+DEN at 8 months post-infection. PCNA+ cells per 100 hepatocytes were counted in five to eight randomly selected HPF images of each liver. Each dot represents an HPF image. f IL-10+ Treg frequency in TregST2CKO (n = 7) and WT (n = 7) liver treated with HBV+DEN at 4 months post-infection. Each dot represents a mouse. g Representative images of CD3 and CD8 stained TregST2CKO and WT liver treated with HBV+DEN at 4 months post-infection. Insets highlight T cells in the liver. h Quantification of CD3+ T cells in TregST2CKO (n = 4) and WT (n = 3) liver treated with HBV+DEN at 4 months post-infection. CD3+ cells were counted in three to four randomly selected HPF images per liver sample. Each dot represents an HPF image. i Quantification of CD8+ T cells in TregST2CKO (n = 4) and WT (n = 3) liver treated with HBV+DEN at 4 months post-infection. CD8+CD3+ cells were counted in three to four randomly selected HPF images per liver sample. Each dot represents an HPF image. Graphs show mean + SD, two-sided unpaired t-test, scale bars: 1 cm (liver images) and 100 μm (histology). Source data are provided as a Source Data file.
Fig. 5
Fig. 5. Pitavastatin blocks liver cancer development in chronic inflammation marked by elevated IL-33 expression.
a Representative macroscopic images of pitavastatin- and PBS-treated WT liver exposed to HBV+DEN at 8 months post-infection. Arrows point to liver tumors. b Tumor burden measured as % liver surface area of pitavastatin- (n = 10) and PBS-treated (n = 5) WT mice that received HBV+DEN at 8 months post-infection. Each dot represents a mouse. Experimental data were verified in two independent experiments. c Representative images of H&E stained pitavastatin- and PBS-treated WT liver exposed to HBV+DEN at 8 months post-infection. d Representative images of PCNA stained pitavastatin- and PBS-treated WT liver exposed to HBV+DEN at 8 months post-infection. e Quantification of PCNA+ hepatocytes in pitavastatin- (n = 4) and PBS-treated (n = 5) WT mice that received HBV+DEN at 8 months post-infection. PCNA+ cells per 100 hepatocytes were counted in five to eight randomly selected HPF images of each liver. Each dot represents an HPF image. f Serum IL-33 levels in HBV-positive hepatitis patients (n = 40), HBV-negative hepatitis patients (n = 40), and healthy controls (n = 24). Each dot represents a patient serum sample. g Representative images of IL-33 stained liver tissues from HBV-positive hepatitis patients, HBV-negative hepatitis patients, and healthy control. h A retrospective cohort analysis of hepatitis and HCC in hepatitis risk in matched cohorts of patients treated with pitavastatin (test) versus ezetimibe (control) (two-sided two-proportion z-test). i The correlation between IL33 expression levels and CD8+ T cell and Treg cell infiltration in HCC samples (n = 371) from TCGA. j The correlation between IL1RL1 expression levels and CD8+ T cell and Treg cell infiltration in HCC samples (n = 371) from TCGA. k Schematic diagram outlining the mechanism that links HBV infection to increased hepatitis and HCC risk (Created in BioRender. Demehri, S. (2025) https://BioRender.com/taqks8w). Graphs show mean + SD, (b, e) two-sided unpaired t-test, (f) one-way ANOVA with Tukey’s multiple comparison test, (i, j) two-sided t-test for Pearson correlation coefficient, scale bars: 1 cm (liver images) and 100 μm (histology). Source data are provided as a Source Data file.

References

    1. Hsu, Y. C., Huang, D. Q. & Nguyen, M. H. Global burden of hepatitis B virus: current status, missed opportunities and a call for action. Nat. Rev. Gastroenterol. Hepatol.20, 524–537 (2023). - PubMed
    1. Yuen, M. F. et al. Hepatitis B virus infection. Nat. Rev. Dis. Prim.4, 18035 (2018). - PubMed
    1. Iannacone, M. & Guidotti, L. G. Immunobiology and pathogenesis of hepatitis B virus infection. Nat. Rev. Immunol.22, 19–32 (2022). - PubMed
    1. Jiang, Y., Han, Q., Zhao, H. & Zhang, J. The mechanisms of HBV-induced hepatocellular carcinoma. J. Hepatocell. Carcinoma8, 435–450 (2021). - PMC - PubMed
    1. Howell, J. et al. Pathway to global elimination of hepatitis B: HBV cure is just the first step. Hepatology78, 976–990 (2023). - PMC - PubMed

MeSH terms

LinkOut - more resources