. 2025 Jul;11(7):1353-1366.
doi: 10.1038/s41477-025-02030-9. Epub 2025 Jun 27.

The synaptonemal complex central element SCEP3 interlinks synapsis initiation and crossover formation in Arabidopsis thaliana

Affiliations

The synaptonemal complex central element SCEP3 interlinks synapsis initiation and crossover formation in Arabidopsis thaliana

Chao Feng et al. Nat Plants. 2025 Jul.

Abstract

The synaptonemal complex (SC) forms between homologous chromosomes during meiosis. In Arabidopsis thaliana, its central region (CR) is composed of the transverse filament protein ZYP1 and the central element proteins SCEP1 and SCEP2. Here we identify SCEP3 as a CR protein that is evolutionarily conserved across plant species. SCEP3 spatiotemporally overlaps with other CR proteins and localizes to the SC CR. The loss of SCEP3 prevents SC assembly, abolishes crossover (CO) assurance and interference, and eliminates sex-specific differences in CO rates (heterochiasmy) through increased CO in females. SCEP3 is required for a subset of COs in SC-deficient mutants, such as zyp1. Although SCEP3 physically interacts with ZYP1, it loads independently of other CR proteins. We propose that SCEP3 may associate with certain recombination intermediates, stabilizing them and/or recruiting additional factors, such as ZYP1, to a subset of these intermediates, thereby promoting and interlinking SC assembly and CO formation.


Conflict of interest statement

Competing interests: The authors declare no competing interests.

Figures

Fig. 1
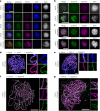
Fig. 1. Identification of SCEP3 and phenotypic analysis of scep3 mutants.
a, Gene model of SCEP3 (AT4G18490; confirmed by Sanger sequencing of flower bud complementary DNA), including exons (black boxes) and introns (black lines), and a schematic depiction of the SCEP3 protein. The locations of mutant alleles are indicated: scep3-1 (initially named atc21-1 (ref. )) and scep3-2 (transfer DNA insertions within exon 13 and intron 8, respectively) as well as scep3-3 and scep3-4 (CRISPR–Cas9-based mutagenesis); scep3-4 is in Ler-0, while all other alleles are in the Col-0 background. b, Seeds per silique in the WT (54.33 ± 5.38, n = 40), scep3-1 (37.98 ± 5.76, n = 40), scep3-2 (37.9 ± 4.75, n = 40), scep3-3 (38.05 ± 4.44, n = 40) and scep3-1scep3-2 (36.33 ± 3.59, n = 40). No significant differences were found among the scep3 mutants (P = 0.30). However, all scep3 mutants produced significantly fewer seeds than the WT (P < 1 × 10−7). c, Male meiotic chromosome behaviour (scale bars, 10 μm; DNA counterstained with DAPI is shown in grey) in the WT and scep3 mutants. d, Frequency of cells with zero to three pairs of univalents, including the average bivalent number per cell (n is the number of cells analysed) in the WT and scep3 mutants. e, Left, 3D-SIM analysis of REC8 immunolocalization in male and female meiocytes of Col-0 and scep3-1. Along synapsed chromosomes, the two parallel lateral elements exhibit an average distance of 188 ± 21.6 nm (range, 148–243 nm; n = 26) in WT males and 187 ± 19.4 nm (range, 162–223 nm; n = 15) in WT females. In scep3-1, within regions of alignment, the average distance increased to 352 ± 87.5 nm (range, 189–592 nm; n = 37) in males and 311 ± 74.6 nm (range, 184–423 nm; n = 12) in females, showing greater variation. Single-slice images were used to measure the distances between two aligned axes. Scale bars, 2 μm. Right, quantification of aligned axis distances (the measurement points were randomly selected) in both Col-0 and scep3-1. ASY4-labelled lateral elements exhibit an average distance of 176 ± 13.4 nm (range, 149–197 nm; n = 28) in WT males. f, Female meiotic chromosome spreads of Col-0 and scep3-2 (DAPI-stained DNA is shown in grey). The experiments were repeated three times with similar results. Scale bars, 10 μm. Distinct plants from each mutant line (or the WT) were used for seed counting and chromosome spread analysis. Significance was evaluated using one-way ANOVA with post hoc Bonferroni multiple comparison. The data are presented as mean ± s.d. **P < 0.01. NS, not significant. Source data
Fig. 2
Fig. 2. Localization of SCEP3 at the CR of the SC.
ac, Immunolocalization in the WT of SCEP3-N, ZYP1-C and ASY1 during prophase I (a); SCEP3-C and SCEP3-N during zygotene and pachytene (b); and SCEP3-C with SCEP2 or SCEP3-N with SCEP1 at pachytene (c). DAPI-stained DNA is shown in grey. d,e, 3D-SIM of a pachytene nucleus in the WT immunolabelled with REC8, ZYP1-C and SCEP3-N (d) or ASY4, ZYP1-C and SCEP3-C (e). f,g, STED microscopy of a WT pachytene nucleus immunolabelled with ZYP1-C and SCEP3-N (f) or ZYP1-C and SCEP3-C (g). Scale bars, 10 μm in ac, 2 μm in dg. All experiments were repeated at least two times with similar results. Source data
Fig. 3
Fig. 3. SCEP3 is critical for SC assembly, and its localization is independent of other CR proteins.
ac, Immunolocalization in WT and scep3-1 pachytene nuclei of ZYP1-C and ASY1 (a), SCEP1 and ASY1 (b), and SCEP2 and ASY1 (c). df, Immunolocalization of SCEP3-N and ASY1 in the WT, zyp1-2, scep1-1 and scep2-1 (d); SCEP3-N and ZYP1-C in scep1-1 and scep2-1 (e); and SCEP1 or SCEP2 and ASY1 in zyp1-2 (f). DAPI-stained DNA is shown in grey. All experiments were repeated three times with similar results. Scale bars, 10 µm.
Fig. 4
Fig. 4. SCEP3 physically interacts with ZYP1.
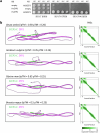
a, Schematic depictions of ZYP1b (left) and SCEP3 (right), including fragments tested by Y2H assays. In ZYP1b, the central α-helical domain (orange) is flanked by two flexible regions (pink and green). SCEP3 consists of the C-terminal α-helical domain (blue) and the N-terminal disordered region (red). Green, grey and black lines indicate positive interaction, negative interaction and self-activation, respectively, in the Y2H experiments depicted below. b, Y2H interaction studies of ZYP1 and SCEP3. Both ZYP1a and ZYP1b interact with SCEP3 (full-length proteins). To determine the subregion within ZYP1 and SCEP3 responsible for their interaction, ZYP1 (ZYP1b was used) was divided into four fragments and SCEP3 into two. The N-terminal region of ZYP1 (amino acids 49–400) and the C-terminal region of SCEP3 (amino acids 734–803) were found responsible for the interaction between SCEP3 and ZYP1. Selection with minimal SD Base medium supplemented with DO Supplement −Leu/−Trp (SD/−LT (DDO)); DO Supplement −His/−Leu/−Trp (SD/−LT (TDO)); or DO Supplement −Ade/−His/−Leu/−Trp (SD/−LT (QDO)). c, AlphaFold3 predicts interaction between the C terminus of SCEP3 and full-length ZYP1b (~100–200 amino acids) in Arabidopsis. Predicted aligned error values are shown on the right; the interface predicted template modelling score is 0.48, and the predicted template modelling score is 0.24. Note that AlphaFold’s prediction of the global structure of ZYP1 is not consistent with cytological evidence that the N terminus and C terminus are apart, as previously described.
Fig. 5
Fig. 5. SCEP3 is critical for class I and class II CO formation.
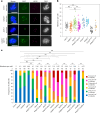
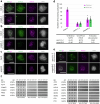
a,b, Immunolocalization of ASY1 and HEI10 (a) and quantification of HEI10 foci number per diakinesis cell (b) in WT (10.34 ± 1.74, n = 41), scep3-1 (9.94 ± 2.43, n = 51), zyp1-2 (13.18 ± 2.94, n = 66), scep3-1zyp1-2 (10.03 ± 2.43, n = 59), scep1-1 (13.94 ± 3.62, 18) and scep2-1 (14.59 ± 2.29, n = 17) male meiocytes, as well as WT (5.91 ± 1.86, n = 23) and scep3-1 (10.17 ± 3.31, n = 6) female meiocytes. Significant differences were found between scep3-1 and zyp1-2 (P < 1 × 10−7) as well as zyp1-2 and scep3-1zyp1-2 (P < 1 × 10−7), but not between scep3-1 and the WT (P = 1) or scep3-1 and scep3-1zyp1-2 (P = 1). DNA counterstained with DAPI is shown in merged and single-channel images in blue and grey, respectively. Scale bars, 10 μm. c, Frequency of cells with zero to five pairs of univalents including the average bivalent number per cell in a series of single or double mutants. Significant differences were found between zyp1-2 and scep3-1zyp1-2 (P = 2.32 × 10−7), asy1-4 and scep3-2asy1-4 (P < 1 × 10−7), scep3-2 and scep3-2asy1-4 (P < 1 × 10−7), asy3-1 and scep3-2asy3-1 (P = 3.26 × 10−6), scep3-2 and scep3-2asy3-1 (P < 1 × 10−7), msh5-2 and scep3-1msh5-2 (P = 0.016), scep3-1 and scep3-1msh5-2 (P < 1 × 10−7), hei10-2 and scep3-2hei10-2 (P = 4.56 × 10−7), scep3-2 and scep3-2hei10-2 (P < 1 × 10−7), scep3-2 and scep3-2mlh3-1 (P < 1 × 10−7), mlh3-1 and scep3-2mlh3-1 (P < 1 × 10−7), and mus81-2 and scep3-1mus81-2 (P < 1 × 10−7), but not between scep3-1 and scep3-1zyp1-2 (P = 0.41) or scep3-1 and scep3-1mus81-2 (P = 0.31). Distinct plants from each single or double mutant line (or the WT) were used for immunolocalization and chromosome spread analysis. Significance was assessed using one-way ANOVA with post hoc Bonferroni multiple comparison. The data are presented as mean ± s.d. *P < 0.05; **P < 0.01. Source data
Fig. 6
Fig. 6. SCEP3 associates with HEI10 independently of SC assembly.
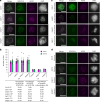
a, Immunolocalization of SCEP3-N and HEI10 in early pachytene nuclei of the WT, zyp1-2, scep1-1 and scep2-1. b, Quantification of SCEP3 and HEI10 foci numbers and their percentage of overlap in WT (HEI10, 83 ± 8.1; SCEP3, 94 ± 29.9; n = 7), zyp1-2 (HEI10, 88 ± 13.3; SCEP3, 95 ± 13.4; n = 10), scep1-1 (HEI10, 93 ± 24.2; SCEP3, 92 ± 23.9; n = 9) and scep2-1 (HEI10, 95 ± 16.7; SCEP3, 99 ± 22.1; n = 5) early pachytene (EP), as well as zyp1-2 (HEI10, 21 ± 3.4; SCEP3, 21 ± 0.9; n = 5), scep1-1 (HEI10, 20 ± 2.5; SCEP3, 20 ± 3.5; n = 3) and scep2-1 (HEI10, 24 ± 3.5; SCEP3, 21 ± 2.2; n = 4) late pachytene (LP). c,d, Same as a, but in late pachytene and diplotene nuclei, respectively. Distinct plants from each mutant line (or the WT) were used for immunolocalization analysis. DAPI-stained DNA is shown in grey. Scale bars, 10 µm. The data are presented as mean ± s.d. Source data
Fig. 7
Fig. 7. CO interference and heterochiasmy vanish in scep3.
a, Number of COs (the data are presented as mean ± s.e.m.) detected by sequencing of recombinant offspring of WT males (4.80 ± 0.17), WT females (3.00 ± 0.11), scep3-2 males (6.00 ± 0.24) and scep3-2 females (6.15 ± 0.23). The sample sizes used for analysis are indicated in parentheses. Significant differences were detected between WT males and females (P < 1 × 10−7), but not between scep3-2 males and females (P = 0.942) (nested ANOVA followed by Tukey’s honestly significant difference test, a two-sided test with adjustment for multiple comparisons). Compared with the WT, in scep3-2 CO numbers significantly increased in both males (P = 5.09 × 10−4) and females (P < 1 × 10−7). b, CO distribution along chromosome 2 in male and female WT, zyp1 (ref. ), scep1-1 (ref. ) and scep3-2. Centromere and pericentromere regions are indicated in grey and blue, respectively. CO data are presented within 1-Mb windows. Significant differences (based on χ2 tests) between the WT and scep3-2 (green dots), scep3-2 and zyp1 (red dots) and scep3-2 and scep1-1 (orange dots) are indicated. c, Distribution of inter-CO distances (only chromosomes with exactly two COs are included for analysis) in male and female WT and scep3-2. Calculated random distributions are shown in grey. The statistical significance is indicated in parentheses (nested ANOVA followed by Tukey’s honestly significant difference test, a two-sided test with adjustment for multiple comparisons). d, The coefficient of coincidence (CoC) was calculated for inter-interval distances ranging from 1 Mb to 15 Mb for each chromosome, and a LOESS curve was fitted (coloured lines). e, Immunolocalization of ASY1 and HEI10 in WT and scep3-1 female meiocytes. DAPI-stained DNA is shown in blue. Scale bars, 10 μm. Source data
Extended Data Fig. 1
Extended Data Fig. 1. Isolation of scep3-3 and phenotypic analysis of scep3 alleles.
a, SCEP3 full-length protein structure prediction by AlphaFold2. b, Isolation of scep3-3. Top: CRISPR/Cas9-mediated 22 bp deletion in exon 5 resulting in a predicted truncated protein of 201 AA; PAM sequence underlined and deleted bases as red dashes. Below: Alignment of SCEP3 WT and SCEP3-3 proteins. c, Seed abortion (indicated by asterisks) in the WT and scep3 alleles. d, Alexander staining of pollen grains (arrowheads indicate non-viable ones in blue; scale bar, 100 µm) and quantification of pollen viability in Col-0 (0.99 ± 0.01, n = 5), scep3-2 (0.92 ± 0.02, n = 5) and scep3-3 (0.93 ± 0.01, n = 3). Significance evaluated by one-way ANOVA with post-hoc Bonferroni multiple comparison (Col-0 and scep3-2, P = 1.26×10⁻⁴; Col-0 and scep3-3, P = 4.48×10⁻⁴; scep3-2 and scep3-3, P = 1). Data are presented as mean ± standard deviation (s.d.). **P < 0.01. N.S., not significant. Source data
Extended Data Fig. 2
Extended Data Fig. 2. Both SCEP3-N and SCEP3-C antibodies localize to the SC and are specific for SCEP3 (signal absence in scep3).
Immunolocalization in pachytene nuclei of a, SCEP3-N and SCEP3-C in Col-0 (Images acquired by 3D-SIM or STED; Scale bar, 2 μm), and of b, SCEP3-N or SCEP3-C together with ASY1 in scep3-2. DNA counterstained with DAPI in gray. The experiments were repeated three times with similar results. Scale bar, 10 μm.
Extended Data Fig. 3
Extended Data Fig. 3. Co-localization of SCEP3 and ZYP1 in various meiotic mutants.
Immunolocalization of SCEP3-N, ZYP1-C and ASY1 or REC8 in spo11-2-3, mtopVIB-2, dmc1-2, asy3-1, rec8-1, pch2-1, asy1-4, msh5-2, hei10-2, zip4-2, mer3-1, and shoc1-1 pachytene(-like) nuclei. DNA stained with DAPI in gray. All experiments were repeated at least two times with similar results. Scale bar, 10 μm.
Extended Data Fig. 4
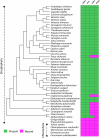
Extended Data Fig. 4. Evolutionary analysis of SCEP3 and other CR components.
The evolutionary tree is constructed based on SCEP3 homologous sequences (PSI blast results using Arabidopsis SCEP3 as seed sequence) from Streptophyta species. Accessions used: A. thaliana (NP_001328810.1), A. lyrata (XP_020875481.1), Capsella rubella (XP_023635313.1), Eutrema salsugineum (XP_024005618.1), Brassica rapa (XP_009136934.2), B. napus (XP_013737233.2), B. oleracea (XP_013594171.1), Gossypium hirsutum (XP_040935483.1), G. arboretum (KAK5792206.1), Theobroma cacao (XP_017978471.1), Citrus sinensis (XP_024950445.1), Phaseolus vulgaris (XP_007153704.1), Cajanus cajan (XP_029124714.1), Medicago truncatula (XP_039689560.1), Glycine max (XP_040873294.1), Ricinus communis (XP_048229528.1), Jatropha curcas (XP_020541047.2), Populus trichocarpa (KAI5570781.1), Cucumis sativus (XP_011658243.1), Solanum lycopersicum (XP_019067843.1), S. tuberosum (KAH0717859.1), Sorghum bicolor (XP_021312987.1), Zea mays (XP_008673176.1), Setaria italic (XP_004969993.2), Oryza sativa (KAF2952333.1), O. brachyantha (XP_040380573.1), Brachypodium distachyon (KQK09796.1), Ananas comosus (XP_020098929.1), H. vulgare (XP_044977082.1), Nicotiana tabacum (XP_016437386.1), Triticum aestivum (KAF7023752.1), Musa acuminate (XP_018686223.1), Amborella trichopoda (XP_020527858.1), Taxus chinensis (KAH9309445.1), Selaginella moellendorffii (XP_024528147.1), Nymphaea colorata (XP_049931681.1), Cryptomeria japonica (XP_059065081.1), Adiantum nelumboides (MCO5557227.1), Ceratopteris richardii (KAH7301291.1), Diphasiastrum complanatum (KAJ7553908.1), Marchantia polymorpha (PTQ45356.1), Chara braunii (GBG74560.1), Klebsormidium nitens (GAQ79536.1). Some Streptophyta and Chlorophyta species without SCEP3 homolog identified are also listed. The color-coded table includes SCEP3, ZYP1, SCEP1 and SCEP2 and shows the presence (green) or absence (purple) of respective homologs in different species.
Extended Data Fig. 5
Extended Data Fig. 5. Conservation of the SCEP3 and ZYP1 interaction in plants.
a, Y2H interaction of H. vulgare ZYP1 and SCEP3 (full-length proteins). Note, TDO (SD/-LTH) is a less and QDO (SD/-LTHA) a more stringent medium for selection. b, AlphaFold3 interaction prediction using the C-terminus (α-helical domain) of SCEP3 and full-length ZYP1 (ZEP1 is the rice ZYP1 homolog) from O. sativa, H. vulgare, G. max or B. napus. PAE values are shown on the right; ipTM and pTM values indicated in parentheses.
Extended Data Fig. 6
Extended Data Fig. 6. Similar γH2Ax foci numbers in scep3 when compared with the WT and absence of HEI10 immunofluorescence signals in hei10-2.
a, Immunolocalization of ASY1 and γH2Ax in WT and scep3-2 meiocytes. γH2Ax signal channel is depicted on the right (gray). Scale bar, 10 μm. b, Quantification of γH2Ax foci numbers in Col-0 (187 ± 51 nm, n = 31) and scep3-2 (177 ± 31 nm, n = 30) meiocytes (late leptotene/early zygotene). Data are presented as mean ± standard deviation (s.d.). No significant difference was found between Col-0 and scep3-2 (P = 0.36, two-sided Student’s t-test). N.S., not significant. c, Immunolocalization of HEI10 and ASY1 in hei10-2. The experiment was repeated two times with similar results. Source data
Extended Data Fig. 7
Extended Data Fig. 7. SCEP3 is required for some chiasmata in SC-deficient or ZMM mutants.
Minimum chiasma number counts in single (scep3-1, scep3-2, zyp1-2, asy1-4, asy3-1, msh5-2, hei10-2, mlh3-1, mus81-2) and double (scep3-1zyp1-2, scep3-2asy1-4, scep3-2asy3-1, scep3-1msh5-2, scep3-2hei10-2, scep3-2mlh3-1, scep3-1mus81-2) mutants. Chromosome spreads were analysed for each mutant using flower buds from distinct plants. The number of cells (n) analysed is indicated at the top. Significance evaluated by one-way ANOVA with post-hoc Bonferroni multiple comparison (zyp1-2 and scep3-1zyp1-2, P < 1×10⁻⁷; zyp1-2 and scep3-1zyp1-2, P = 0.71; asy1-4 and scep3-2asy1-4, P = 1.96×10⁻⁷; scep3-2 and scep3-2asy1-4, P < 1×10⁻⁷; asy3-1 and scep3-2asy3-1, P = 6.39×10⁻⁴; scep3-2 and scep3-2asy3-1, P < 1×10⁻⁷; msh5-2 and scep3-1msh5-2, P = 0.069; scep3-1 and scep3-1msh5-2, P < 1×10⁻⁷; hei10-2 and scep3-2hei10-2, P = 4.72×10⁻³; scep3-2 and scep3-2hei10-2, P < 1×10⁻⁷; mlh3-1 and scep3-2mlh3-1, P < 1×10⁻⁷; scep3-2 and scep3-2mlh3-1, P < 1×10⁻⁷; mus81-2 and scep3-1mus81-2, P < 1×10⁻⁷; scep3-1 and scep3-1mus81-2, P = 1.51×10⁻³). Data (refer to Supplemental Table 1) are presented as mean ± standard deviation (s.d.). **P < 0.01. N.S., not significant. Source data
Extended Data Fig. 8
Extended Data Fig. 8. Localization of CR proteins and HEI10 in scep3, spo11-1-3 and mtopVIB-2 as well as no direct interaction of SCEP3 with selected proteins in Y2H.
Immunolocalization of a, ZYP1-C and HEI10, b, SCEP1 and HEI10, and c, SCEP2 and HEI10 in early pachytene nuclei of WT and scep3-1. d, Quantification of SCEP3 and HEI10 foci numbers in scep3-1 (HEI10, 91 ± 8.1; n = 7), spo11-1-3 (HEI10, 17 ± 5.6; SCEP3, 18 ± 3.6; n = 15), and mtopVIB-2 (HEI10, 38 ± 9.7; SCEP3, 39 ± 8.1; n = 14) as well as their percentage of overlap in spo11-1-3 and mtopVIB-2. Data are presented as mean ± standard deviation (s.d.). e, Immunolocalization of SCEP3 and HEI10 in early pachytene nuclei of spo11-1-3 and mtopVIB-2. DAPI-stained DNA in gray. Scale bar, 10 µm. f, Interactions tested between SCEP3 and axis(-associated) (ASY4, COMET or PRD3) or ZMM proteins (ZIP4, HEI10, MER3 or PTD) in Y2H. TDO (SD/-LTH) is a less stringent and QDO (SD/-LTHA) is a more stringent medium used for selection. The experiments (a-c, e) were repeated at least three times with similar results. Source data
Extended Data Fig. 9
Extended Data Fig. 9. Isolation of scep3-4 in Ler-0.
a, Details on the CRISPR/Cas9-mediated allele scep3-4: 2 bp deletion within exon five resulting in a predicted truncated protein of 182 AA. PAM sequence underlined and deleted bases as red dashes. Below: alignment of SCEP3 wildtype and truncated SCEP3-4 protein. b, Seed setting in siliques of Ler-0 and scep3-4. Seed abortion indicated by asterisks. c, Male meiotic chromosome spreads and d, quantification of univalent frequency in Ler-0 and scep3-4. Source data
Extended Data Fig. 10
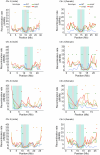
Extended Data Fig. 10. Genome-wide CO distribution in WT and scep3.
CO distribution along chromosomes 1, 3, 4 and 5 in male and female of WT, zyp1, scep1-1 and scep3-2 plants (refer to Fig. 7b).

References

    1. Zickler, D. & Kleckner, N. Meiosis: dances between homologs. Annu. Rev. Genet.57, 1–63 (2023). - PubMed
    1. de Massy, B. Initiation of meiotic recombination: how and where? Conservation and specificities among eukaryotes. Annu. Rev. Genet.47, 563–599 (2013). - PubMed
    1. Mercier, R., Mezard, C., Jenczewski, E., Macaisne, N. & Grelon, M. The molecular biology of meiosis in plants. Annu. Rev. Plant Biol.66, 297–327 (2015). - PubMed
    1. Börner, G. V., Kleckner, N. & Hunter, N. Crossover/noncrossover differentiation, synaptonemal complex formation, and regulatory surveillance at the leptotene/zygotene transition of meiosis. Cell117, 29–45 (2004). - PubMed
    1. Snowden, T., Acharya, S., Butz, C., Berardini, M. & Fishel, R. hMSH4–hMSH5 recognizes Holliday junctions and forms a meiosis-specific sliding clamp that embraces homologous chromosomes. Mol. Cell15, 437–451 (2004). - PubMed

MeSH terms

Substances

LinkOut - more resources