. 2025 Oct;20(10):1473-1481.
doi: 10.1038/s41565-025-01965-6. Epub 2025 Jun 27.

Nanopore detection of single-nucleotide RNA mutations and modifications with programmable nanolatches

Affiliations

Nanopore detection of single-nucleotide RNA mutations and modifications with programmable nanolatches

Yunxuan Li et al. Nat Nanotechnol. 2025 Oct.

Abstract

RNA mutations and modifications have been implicated in a wide range of pathophysiologies. However, current RNA detection methods are hindered by data complexity and error-prone protocols, restricting their widespread use. Here we present a solid-state nanopore-based approach, RNA single-nucleotide characterization and analysis nanolatch (RNA-SCAN) system, which simplifies the detection of nucleotide mutations and modifications in RNA with high resolution. Using phage RNA as a template, we tested multiple sequences and chemical modifications on nanolatches, allowing the detection of mismatches caused by nucleotide mutations through significant changes in positive event ratios using single-molecule nanopore measurements. This approach is also sensitive to modifications that either strengthen or weaken the interaction between the target RNA sequence and the nanolatch. As a proof-of-concept, we demonstrate successful discrimination of Escherichia coli and Salmonella spp. from total RNA based on nucleotide variations in their 16S rRNA, as well as quantification of different Salmonella spp. and detection of m5C1407 modification on E. coli 16S rRNA. The RNA-SCAN approach demonstrates the feasibility of combining RNA/DNA hybrid nanotechnology with nanopore sensing and diagnosing RNA-related health conditions.


Conflict of interest statement

Competing interests: The authors declare no competing interests.

Figures
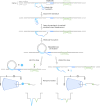
Fig. 1
Fig. 1. RNA-SCAN: a nanolatch-nanopore sensor for nucleic acid characterization.
The RNA-SCAN mechanism proceeds as follows (where the complementary strand regions indicated by matching colours). A hairpin-like nanolatch is first captured and opened by an overhang on the RNA/DNA carrier (self-assembled from a long RNA scaffold and short DNA oligos) through toehold-mediated strand displacement, exposing its target site-complementary segment. Molecular fluctuations in solution then bring the nanolatch’s free end into proximity to the target site, forming a metastable loop structure referred to as the ‘on the latch’ state, a configuration that is formed but not yet fastened. The subsequent stability of the loop depends on base-pairing strength between the nanolatch and target site, resulting in either a ‘latched’ state (where strong complementarity fastens the loop) or an ‘unlatched’ state (where weak binding leads to loop opening). During nanopore detection, the translocation of the carrier generates a characteristic baseline current drop. A six-dumbbell structure (marked in green) positioned next to the target site consistently produces a small spike of approximately half the amplitude of the first-level current drop generated by the carrier alone, serving as a reference. In comparison, a latched loop typically generates a spike larger than the reference spike, approaching the magnitude of the first-level current drop, while an unlatched loop yields minimal current fluctuation beyond the plateau.
Fig. 2
Fig. 2. Detection of nucleotide mutations on engineered nanolatches.
a, A sketch of the MS2 carrier design and sequence comparison between the complementary nanolatch (MH) and its six mutated variants (MHm1–MHm6), highlighting nucleotide changes in both pairing and competitive areas that interact with the target site on the MS2 carrier. b, The mechanism of the competitive interaction between the MS2 RNA target site and nanolatches/complementary DNA oligo, illustrated using the fully complementary nanolatch MH and single-nucleotide mutated nanolatch MHm1. The representative nanopore current traces exhibit distinct signatures corresponding to the ‘loop latched’ (positive event) and ‘loop unlatched’ (negative event) states. The positive event ratio is defined as the number of positive events divided by the total number of events per measurement (n = 100). c, An analysis of positive event ratios for nanolatches MH–MHm6. The bar charts present positive event ratios from three independent measurements (N = 3) for each nanolatch. The data are shown as the mean ± standard deviation. Source data
Fig. 3
Fig. 3. Detection of modifications on nanolatches.
a, A schematic depicting how 5mC modification influences C/G base pairing before and after bisulfite conversion. The MS2 carrier design is identical to that in Fig. 2. b, The nanopore measurement results of MS2 carriers incubated with nanolatches containing 0–4 5mC modifications, with (+) and without (−) bisulfite treatment. c, A schematic of how inosine modification affects A/U base pairing, along with nanopore measurement results for nanolatches containing 0–4 inosines in the sequence. d, A schematic of MeC modification and nanopore measurement results for nanolatches possessing 0–4 MeCs. The data in bd are shown as the mean ± standard deviation from three independent measurements. e, A theoretical model of the nanolatch system for detecting modifications. The presence of modifications can either strengthen or weaken the stability of the duplex between the nanolatch and the RNA scaffold, altering the energy difference ΔG between ‘latched’ and ‘unlatched’ energy levels. R is the ideal gas constant, T is the absolute temperature at which the reaction occurs, Kn is the equilibrium constant of loop latching, and n is the number of modifications. f, The linear fitting results of ln(Kn) against n for each type of modifications studied in this work. 5mC (+) and 5mC (−) refer to cytosine methylations with (+) and without (−) bisulfite treatment, respectively. The data point for four inosines (open square) was excluded from fitting, as the positive event ratio had already dropped to nearly 0% with three inosines. Source data
Fig. 4
Fig. 4. Detection and quantification of E. coli and Salmonella species based on nucleotide variations in their 16S rRNA sequences.
a, A schematic of the E. coli/S. Typhi 16S rRNA carrier design with a reference structure positioned on one side of the carrier and a target site located at the centre. b, The sequences of E. coli and S. Typhi 16S rRNA at the target site, highlighting a single-nucleotide variation. c, Representative nanopore current traces of the E. coli/S. Typhi 16S rRNA carrier. d, The analysis of the positive event ratio for the four combinations of E. coli/S. Typhi carrier with E. coli/S. Typhi nanolatch. The carrier concentration was set at 0.3 nM at the start of nanopore measurements and the nanolatch concentration at 3 nM for both E. coli and S. Typhi. e, A schematic of the Salmonella 16S rRNA carrier design with two reference structures placed on one side and a target site on the other side. f, The sequences of S. Typhi and S. Enteritidis 16S rRNA at the target site, highlighting three continuous different bases. g, Representative nanopore current traces of the Salmonella 16S rRNA carrier. h, An analysis of the positive event ratio for total RNA mixtures of S. Typhi and S. Enteritidis at defined input ratios, using either the S. Typhi or S. Enteritidis nanolatch. The combined concentration of S. Typhi and S. Enteritidis 16S rRNA carriers was maintained at 0.3 nM in all nanopore measurements, with a constant nanolatch concentration of 3 nM. The data in d and h are shown as mean ± standard deviation from three independent measurements. Source data
Fig. 5
Fig. 5. Detection of m5C modification on E. coli 16S rRNA compared with A. baumannii 16S rRNA.
a, A modification map of E. coli 16S rRNA, highlighting the essential role of the methyltransferase RsmF in catalysing methylation at cytosine 1407. b, The sequences of E. coli and A. baumannii 16S rRNA at the target site. The cytosine at position 1407 is methylated in E. coli 16S rRNA but remains unmethylated in A. baumannii 16S rRNA. c, A schematic of the E. coli/A. baumannii 16S rRNA carrier design, featuring a reference structure on one side of the carrier and the target site at the opposite end. d, Representative nanopore current traces of the E. coli/A. baumannii 16S rRNA carrier. e, The analysis of the positive event ratio for E. coli and A. baumannii 16S rRNA carriers using the same nanolatch. The carrier concentration was maintained at 0.3 nM and the nanolatch concentration at 3 nM. The higher positive event ratio observed for E. coli can be attributed to the stabilizing effect of the m5C modification at the target site. The data are shown as mean ± standard deviation from three independent measurements. Source data
Extended Data Fig. 1
Extended Data Fig. 1. Comparison of nanopore current signals produced by latched loop and unlatched overhang structures in RNA-SCAN and target-blocked MS2 carrier designs.
a, Schematic of the RNA-SCAN MS2 carrier design, featuring a reference structure and an open target site capable of forming a loop with the nanolatch. b, Representative nanopore translocation events of the RNA-SCAN carrier. A minor slope correction is applied to the baseline, which is likely due to slight changes in buffer concentration during the measurements. ΔI denotes the secondary current drop caused by structures on the carrier, while ΔI0 denotes the first-level current drop from the carrier backbone. ΔI/ΔI0 is calculated to analyze the significance of nanopore signals generated by additional structures on the carrier. c, Analysis of ΔI/ΔI0 values for the loop and reference structures on the RNA-SCAN carrier from three independent nanopore measurements. Box plots show the median (center line), the 25th and 75th percentiles (box bounds), and whiskers extending to 1.5× IQR; minima and maxima refer to the lowest and highest data points within this range. About 46 events in each measurement exhibit a distinct loop spike, with ΔI/ΔI0 values mostly exceeding the 0.55 threshold used to distinguish positive events from negative events. ΔI/ΔI0 values of the reference structure are consistently around 0.5. d, Schematic of the target-blocked MS2 carrier design, featuring a reference structure and a DNA overhang at the central. e, Representative nanopore translocation events of the target-blocked carrier, showing only small spikes or no spike at the target site. f, Analysis of ΔI/ΔI0 values for the overhang and loop structures on the target-blocked carrier from three independent nanopore measurements. Only about 30 events exhibit an identifiable spike at the target site, with ΔI/ΔI0 values generally below 0.55, though occasional outliers are observed. Source data
Extended Data Fig. 2
Extended Data Fig. 2. Verification of the nanolatch design using bulk methods.
a, Schematic of the nanolatch design incorporating fluorophore and quencher pairs, independent of the MS2 carrier context. The positive control nanolatch (MH) induces loop formation by connecting the two ends of the linear complex, bringing the fluorophore and quencher into close proximity and resulting in a non-fluorescent ‘Fluorescence OFF’ state. In contrast, the negative control nanolatch (MT) fails to consistently latch the loop, allowing fluorescence emission and maintaining a ‘Fluorescence ON’ state. b,c, Fluorescence measurements comparing the MT and MH nanolatches. The significantly reduced fluorescence intensity observed for the fully complementary MH nanolatch, relative to the mismatched MT nanolatch, demonstrates both the selectivity (b) and rapid kinetics (c) of loop formation. d, Agarose gel electrophoresis analysis confirming loop formation using the nanolatch strategy. A distinct loop complex band is observed only with a fully complementary nanolatch. Source data
Extended Data Fig. 3
Extended Data Fig. 3. Optimization of pairing and competitive area lengths at the target site.
a, Schematic of the MS2 carrier design. b, Design parameters for each target site, including pairing and competitive area lengths and the corresponding nanolatch sequences. c, Nanopore measurement results for all target site designs, each measured with a fully complementary and a mismatched nanolatch, respectively. The greatest discrimination between non-mismatched and mismatched sequences is observed with a pairing area of 10 nt and a competitive area of 8 nt. Data are presented as mean ± standard deviation from three independent measurements. Source data
Extended Data Fig. 4
Extended Data Fig. 4. Overlaid nanopore current traces and two-dimensional current intensity plots from the first 100 linear events recorded for MS2 carriers interacting with the fully complementary nanolatch (MH, a) and a mismatched nanolatch (taking MHm1 as the example, b).
Data are selected from the three independent measurements of each design whose positive event ratio is closest to the average value. All events are divided into forward and backward translocation groups and are normalized separately by event duration for presentation. All events are aligned to the initial current drop, indicating the entry of the carrier into the nanopore. In the carrier schematic, the same colors as those in Fig. 2 are used to present different structures. The grey line indicates the carrier backbone, the green triangle represents the reference structure, the blue circle refers to a latched loop formed on MS2 carrier with a fully complementary nanolatch, and the short purple line refers to an unlatched sensing overhang without a loop formed. In the two-dimensional plots, colors indicate the magnitude of current drops. The small reference structure usually appears as a light band, while the large spike resulting from loop formation produces a dark-colored band. Negative (unlatched) events lack the loop-associated dark bands. The rectangles on the left of each plot represent the positive events where loops are formed. The clear signature of an additional large spike in the MH group compared to the MHm1 group in the overlaid current traces confirms the more stable loop formation with fully complementary MH than with mismatched MHm1. This is further supported by a greater number of dark bands in the two-dimensional plots of MH. The asymmetric arrangement of carrier structures likely results in the more backward translocation events than forward translocation events. Source data
Extended Data Fig. 5
Extended Data Fig. 5. Overlaid nanopore current traces and two-dimensional current intensity plots from the first 100 linear events recorded for E. coli carriers interacting with the fully complementary E. coli nanolatch (a) and the mismatched S. Typhi nanolatch (b).
The orange circle refers to the latched loop formed on the E. coli carrier with the fully complementary E. coli nanolatch, while the short orange line refers to the sensing overhang in the absence of loop formation when using the mismatched S. Typhi nanolatch. Source data
Extended Data Fig. 6
Extended Data Fig. 6. Overlaid nanopore current traces and two-dimensional current intensity plots from the first 100 linear events recorded for S. Enteritidis carriers interacting with the fully complementary S. Enteritidis nanolatch (a) and the mismatched S. Typhi nanolatch (b).
These events feature two small reference spikes in the current trace. The pink circle refers to the latched loop formed on the S. Enteritidis carrier with the fully complementary S. Enteritidis nanolatch, while the short pink line refers to the sensing overhang in the absence of loop formation when using the mismatched S. Typhi nanolatch. Source data
Extended Data Fig. 7
Extended Data Fig. 7. Overlaid nanopore current traces and two-dimensional current intensity plots from the first 100 linear events recorded for E. coli (with m5C modification at the target site, a) and A. baumannii (without modification, b) carriers, both measured with their shared nanolatch design.
The orange circle refers to the latched loop formed on the E. coli carrier using the EAH nanolatch. Two methylated cytosines are present in the target RNA region. The yellow circle refers to the latched loop formed on the A. baumannii carrier using the same nanolatch. Only one methylated cytosine is present in the target RNA region. Source data
Extended Data Fig. 8
Extended Data Fig. 8. Detection of methylated cytosines in E. coli and A. baumannii 16S rRNA by bisulfite-treated RNA-seq and Sanger sequencing.
16S rRNA from E. coli and A. baumannii are first cleaved by RNase H enzyme near the target site. The cleavage products are then divided into two groups, with one group subjected to bisulfite conversion and the other retaining the native sequence. Subsequently, both groups undergo reverse transcription followed by forty cycles of PCR amplification and are sent for Sanger sequencing. The sequencing results confirm the presence of the m5C1407 modification on E. coli 16S rRNA, which is absent on A. baumannii 16S rRNA. However, both species contain the m4Cm1402 modification on their 16S rRNA. Cm denotes methylated cytosines, and Tc refers to thymines converted from unmethylated cytosines during bisulfite treatment. Source data

References

    1. Chatterjee, A., Mambo, E. & Sidransky, D. Mitochondrial DNA mutations in human cancer. Oncogene25, 4663–4674 (2006). - PubMed
    1. Kanwal, R. & Gupta, S. Epigenetic modifications in cancer. Clin. Genet.81, 303–311 (2012). - PMC - PubMed
    1. Goodall, G. J. & Wickramasinghe, V. O. RNA in cancer. Nat. Rev. Cancer21, 22–36 (2021). - PubMed
    1. Barbieri, I. & Kouzarides, T. Role of RNA modifications in cancer. Nat. Rev. Cancer20, 303–322 (2020). - PubMed
    1. Cosar, B. et al. SARS-CoV-2 mutations and their viral variants. Cytokine Growth Factor Rev.63, 10–22 (2022). - PMC - PubMed

LinkOut - more resources