. 2025 Jul;31(7):2442-2451.
doi: 10.1038/s41591-025-03716-5. Epub 2025 Jun 27.

A reference model of circulating hematopoietic stem cells across the lifespan with applications to diagnostics

Affiliations

A reference model of circulating hematopoietic stem cells across the lifespan with applications to diagnostics

N Furer et al. Nat Med. 2025 Jul.

Abstract

With aging, deviation of human blood counts from their normal range accompanies the transition from health to disease. Hematopoietic stem and progenitor cells (HSPCs) deliver life-long multi-lineage output, but their variation across healthy humans with aging, and their diagnostic utility, haven't been characterized in depth thus far. To address this, we introduced an HSPC reference model using single-cell RNA profiling of circulating CD34+ HSPCs from 148 healthy age- and sex-diverse individuals. We characterized physiological circulating HSPC composition, showed that age-related myeloid bias is predominant in older men and defined age-related transcriptional signatures in lymphoid progenitors. We further demonstrated the potential of this resource to facilitate the diagnosis of myelodysplastic syndrome (MDS) from peripheral blood without bone marrow sampling, defining classes of patients with MDS and abnormal lymphocyte, basophil or granulocyte progenitor frequencies. Our resource provides insights into HSPC reference ranges across the lifespan and has the potential to facilitate the clinical applications of single-cell genomics in hematology.


Conflict of interest statement

Competing interests: Z.S., D.L., E.M. and G.Y. are all employees and shareholders of Ultima Genomics. L.S. is a shareholder of Sequentify. L.S. and A.T. are shareholders of Cliseq. The other authors declare no competing interests.

Figures

Fig. 1
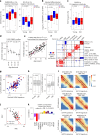
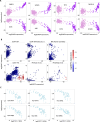
Fig. 1. Mapping cHSPCs.
a, Experimental design. b, Annotated two-dimensional Uniform Manifold Approximation and Projection (UMAP) of our metacell manifold after filtration of metacells with low CD34 expression. For all subsequent panels in Figs. 1–3, metacell color denotes cell state as here. c,d, Symmetrical (c) and asymmetrical (d) regulation of specific HSC TFs on bifurcation to the CLP (right) and MEBEMP (left) lineages. Each panel shows the expression of one gene (y axis). Metacells in all panels are ordered (left to right) by increasing AVP expression in the MEBEMP lineage and decreasing AVP expression in the CLP lineage. The y axes denote log2(fractional expression) of each gene. e, The metacell population of interest (dashed line) linking BEMPs to their MEBEMP-L precursors. f, Positively and negatively regulated TFs involved in early BEMP differentiation. g, Gene–gene plot of IRF8 against TCF7 expression as Hallmark markers of DC and T cell differentiation, respectively. The high ACY3 NKTDP metacell population of interest is depicted (dashed line). h, This population exhibits high expression of both T cell and DC regulators, forming a gradient consisting of NK or T cell-like progenitors exhibiting a high TCF7:IRF8 expression ratio along with high expression of other T cell Hallmarks such as CD7, MAF, IL7R, TRBC2 and DC-like progenitors exhibiting a low TCF7:IRF8 expression ratio, along with high expression of other DC Hallmarks, such as the myeloid TF PU.1 and the MHC-II gene CD74. Panel a created with BioRender.com.
Fig. 2
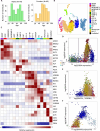
Fig. 2. Normal cHSPC composition.
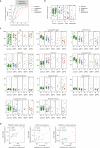
a, Characterization of interindividual cHSPC compositional variation and its correlation to clinical parameters (scheme). b, Boxplots of cHSPC state frequency distributions across 148 healthy individuals (logarithmic scale). The percentage was calculated from all CD34+ cells within each individual’s single-cell ensemble. Boxplot centers, hinges and whiskers represent the median, first and third quartiles and 1.5× the interquartile range, respectively. Outliers are marked by circles. The numbers represent the mean ± s.d. for each distribution. c, Comparison of cell-state frequencies between 19 biological replicates and their original samples, for CLP (CLP-E, CLP-M, CLP-L and NKTDP) populations (top) and MEBEMP (MEBEMP-E, MEBEMP-L, ERYP and BEMP) populations (bottom). The diagonal y = x is shown in red. All biological replicates were sampled 1 year after their original sampling date. d, Top: cell-state frequency profiles over the HSC-MEBEMP and HSC-CLP differentiation gradients of six sampled individuals (colored lines), each representing one of six archetypes (classes) of cHSPC composition observed in healthy individuals. The dashed lines represent the median (black) and the 5th and 95th percentiles (gray) of the studied population. Bottom: cell-state enrichment map over 15 differentiation bins (rows), for all studied individuals (columns) clustered into six classes (Methods). Classes I and II represent individuals relatively enriched in lymphoid progenitors, whereas classes V and VI represent individuals with relative depletion of lymphoid progenitors. Individuals are sorted by stemness within each class. Age and sex are denoted for each individual. e, CBC correlations to cell-state frequencies: %lymphocytes (from white blood cells, calculated for the entire cohort, left), HCT (men only, center) and RDW (men only, right). Missing individuals lacked sufficient cells for analysis. Two-sided permutation test P values are displayed for each correlation. See Methods for details on the permutation-based test. f, CH frequency (by gene) in age- and sex-matched high (red, n = 602) and normal (black, n = 602) RDW individuals selected from a cohort of 18,147 individuals. Panel a created with BioRender.com.
Fig. 3
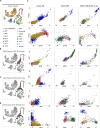
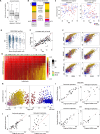
Fig. 3. Age- and sex-linked changes in cHSPC composition.
a, Frequency of MEBEMP (MEBEMP-E, MEBEMP-L, ERYP and BEMP, left) and CLP (CLP-E, CLP-M and CLP-L, right) populations, out of a total CD34+ population, in young (<50 years) versus old (>60 years) individuals without CH, in men (blue) and women (red). The two-sided Kruskal–Wallis P values for differences among groups are denoted. The number of individuals per group is (left to right): 31, 15, 24 and 31. b, Analysis of age-linked compositional differences within the MEBEMP differentiation trajectory, comparing abundance of more (MEBEMP-L) with less (MPP) differentiated states in young versus old individuals. The two-sided Kruskal–Wallis P value for difference among groups is denoted. The number of individuals is as in a. c, As in a, for the HSC population. d, cHSPC frequency per age decimal in an scRNA-seq PBMC dataset of 1,000 healthy individuals. For each decade, mean CD34+ cell frequency is shown (Methods). The 95% confidence intervals are indicated as error bars. The number of individuals in each decade is indicated (top). e, True age (x axis) versus age predicted based on composition-controlled MPP expression (y axis). The diagonal y = x is shown in red. f, Gene–gene correlation heatmap, calculated over individual-level MPP gene expression controlled for MPP composition. g, Individual LMNA signatures (log2(observed:expected ratios)) in lymphoid (CLPs) and early myeloid (MPPs) cell states. h, Analysis of age-linked differences in LMNA signature expression for CLP (right) and MPP (left) populations in young (<50 years) versus old (>60 years) individuals. The y axis denotes log2(observed:expected expression) normalized for composition. The number of individuals is 66 young, 65 old on the left and 48 young, 53 old on the right. The two-sided Mann–Whitney U-test P values are indicated. i, Individual heatmaps of single-cell counts over 20 bins of stemness (AVP signature, y axis) and MEBEMP differentiation (GATA1 signature, x axis). Individual identifier, MCV and RBC are denoted at the top. The diagonal is indicated in black for reference. j, MCV versus RBC in male donors, with colors indicating high (red) and low (black) sync-scores. k, Correlation between individual sync-scores and cell-state compositions in men. The two-sided permutation test P value is denoted. All boxplots are as in Fig. 2b.
Fig. 4
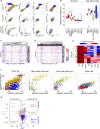
Fig. 4. Applying the cHSPC reference model to MDS diagnosis and subclassification.
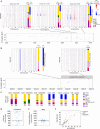
a, Schematics of a diagnostic approach to cytopenia and MDS using scRNA-seq of cHSPCs and a reference model. bd, Cytopenia and MDS patient cHSPC compositions and mutations. b, Each bar represents a patient’s cHSPC composition. Patients exhibiting normal compositions (Methods) are ordered by lymphoid cHSPC frequency (left) and those exhibiting abnormal compositions are ordered by composition hierarchical clustering (right). Cytopenia or MDS subclasses suggested by composition are marked (top). c, Patient composition abnormality scores, depicted by both bar height and color, as coded on the right. d, Patient diagnosis and CH VAF for three specific mutations and the maximal VAF over all other detected mutations, as color coded on the right. Presence of copy number alterations (CNAs) as detected by scRNA, color coded in black. e, Transcriptional signatures across healthy donors and patient groups as in b, further subdivided by sex (men, left; women, right). Individuals exhibiting insufficient cell counts for the population of interest were excluded. Color denotes clinical diagnosis. Mann–Whitney Benjamini–Hochberg-adjusted significance of difference from healthy donors of the same sex is indicated by asterisks (*q < 0.05, **q < 0.01, ***q < 0.001). f, Receiver operator curve for a classification model predicting MDS status based on cHSPC scRNA-seq, CH VAF and CBC values. FPR, false-positive rate; TPR, true-positive rate. g, Frequency of a CLP-E-like cell state across healthy donors and cytopenia and MDS groups, as in e. h, Comparison of BM blast counts measured by FACS and frequency of a CLP-E-like cHSPC population across individuals. Color denotes clinical diagnosis, as in e. Samples excluded from bg due to the presence of a complex karyotype (as detected by scRNA-seq) are highlighted (arrows). Linear fit across all individuals (n = 26) is shown (dashed line), as well as the corresponding r and (two-sided) P value.
Extended Data Fig. 1
Extended Data Fig. 1. Cell state annotation, major markers and regulators of HSC differentiation and sub-population branching.
1A – age distribution (decimals) of studied population by sex. 1B – 2D UMAP projection of our metacell model prior to CD34 metacell filtering. 1C - relative expression heatmap of cell states (columns) and gene markers used for cell state annotation (rows). 1D – Metacell filtration on CD34 expression. 1E - expression plot of MPO and GATA1/VPREB1 showing all 3 differentiation trajectories (GMPs, CLPs, MEBEMPs) from HSCs. 1F - gene-gene expression plot of DNTT and RUNX3, showing early CLP differentiation and their bifurcation into late CLPs and NKTDPs. All gene expression values are obtained by normalizing gene expression to sum to 1 and taking log2.
Extended Data Fig. 2
Extended Data Fig. 2. BM comparisons I.
2A – 2D UMAP projection of a non-CD34-enriched BM metacell model from the Human Cell Atlas, colored by a BM-specific cell state annotation. 2B - projection of our PB CD34+ derived metacells on the non-CD34 enriched BM metacell model. 2C – projection of our BM CD34+ derived metacells on the non-CD34 enriched BM metacell model. 2D - projection of BM CD34+ derived metacells from Setty et al. on the non-CD34 enriched BM metacell model. 2E - gene-gene expression plots comparing PB CD34+ derived metacells with their BM CD34+ counterparts from our study and from Setty et al. for all differentiation trajectories. Panels (top to bottom) represent CLP differentiation, MEBEMP differentiation, GMP differentiation, BEMP differentiation, DC differentiation, and GMP/CLP/MEBEMP trifurcation from HSCs. PB and BM metacells are colored by PB and BM specific annotations.
Extended Data Fig. 3
Extended Data Fig. 3. BM comparisons, Individual-specific state-controlled differential gene expression, megakaryocytic contamination and circulating HSCs.
3A – gene-gene expression plots comparing PB CD34+ derived metacells with their BM CD34+ counterparts from our study and from Setty et al. for markers and regulators of CLP differentiation and bifurcation. 3B – cell state specific comparison of S-phase signatures in circulating (left) and. BM, right) HSPCs. Boxplot centers, hinges and whiskers represent median, first and third quartiles and 1.5× interquartile range, respectively. Outliers are marked by circles. Number of metacells per box (left to right): 89, 124, 261, 1178, 116, 668, 69, 88, 378, 88, 127; 5, 194, 62, 82, 87, 43, 35, 3. 3C,D – Individual-specific differential gene expression after controlling for distribution across the CD34+ PB manifold in MEBEMPs (C) and CLPs (D). 3E - relative expression heatmap of the megakaryocytic markers PF4 and PPBP and cell-state-specific markers, across metacells with high megakaryocytic signature, showing an abnormally high doublet rate involving megakaryocytes. Cells contained in such metacells were accordingly excluded from the final metacell model. 3F - gene-gene expression plots comparing the PB high AVP and HLF HSC population (left) with that found in two BM metacell models, and in our CD34+ BM data. PB and BM metacells are colored by PB and BM specific annotations. 3G – map of transcriptionally activated genes upon exit from the HSC state and differentiation toward lymphoid (CLP) and non-lymphoid (MEBEMP) fates. Dots represent genes. HSC/CLP and HSC/MEBEMP gene expression ratios are depicted on the y and x axis, respectively. Class I genes are representative of the HSC state; Class II genes exhibit symmetric transcriptional activation upon exit from the HSC state towards CLP and MEBEMP fates, whereas Class III, IV, V, VI exhibit asymmetrical transcriptional activation upon exit from the HSC state towards CLP (class III, V) and MEBEMP (Class IV, VI) fates. n is the number of genes in each class.
Extended Data Fig. 4
Extended Data Fig. 4. Factors involved in BEMP and NKTDP differentiation.
4A - factors positively and negatively regulated in the early stages of BEMP specification. 4B – gene-gene expression plots of DNTT and ACY3 comparing CD34-enriched and non-enriched BM to our CD34+ BM model (top), as well as non-enriched and partially CD34-enriched PB to our CD34+ PB model (bottom). Metacells are color-coded by SYT2 expression. The SYT2 high, ACY3 high, DNTT intermediate population clearly seen in our cHSPC data is completely lacking from the BM datasets. 4C – anti-correlation of the DC IRF8-MHC-II coupled dynamics and the T cell regulator TCF7, involved in the bifurcation of the NKTDP state to its sub-populations.
Extended Data Fig. 5
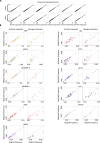
Extended Data Fig. 5. Stability of cell state compositions across technical and biological replicates.
5A – comparison of Illumina and Ultima Genomics sequenced data. Each panel represents one library that was sequenced using both technologies. Points represent genes, and each gene’s expression level across all cells in the library as determined by Illumina (x) and Ultima Genomics (y) is shown. 5B – Cell state frequency comparisons between 39 technical & 19 biological replicates and their original samples. Each pair of panels represents one cell state, denoted on top. Panels on the left of each pair compare the cell state frequency in the original sample, sequenced by Illumina (x), to its technical replicate frequency, sequenced by Ultima Genomics (y). Panels on the right of each pair compare the cell state frequency in the original sample (x) to its frequency in the biological replicate (y). All biological replicates were sampled 1 year following original blood sampling. The diagonal y = x is shown in red.
Extended Data Fig. 6
Extended Data Fig. 6. Composition-controlled transcriptional variation: the LMNA signature and sync score.
6A – boxplots showing CLP frequency distributions in individuals with (right) and without (left) clonal hematopoiesis. Boxplot centers, hinges and whiskers represent median, first and third quartiles and 1.5× interquartile range, respectively. Outliers are marked by circles. Two-sided Mann-Whitney U p-value is indicated. 6B - Relative cell state frequencies in mutant (right) and non-mutant (left) cells following GoT of sample N122 (DNMT3A R882H mutated, VAF = 0.07). P-values were calculated using two-sided Fisher’s exact tests. 6C – Similar data as in Fig. 3a, showing each individual’s age and MEBEMP (left) or CLP (right) cell-state frequency. Each dot represents an individual. Males are color-coded in blue and females in red. P-values for Spearman test of independence are indicated for males and females. 6D – Same data as in Fig. 3d, showing individual age distributions (y axis) stratified by the (down-sampled) number of CD34+ single cells. Boxes represent median, first and third quartiles. Stars denote significant difference from the age distribution of individuals with 0 observed down-sampled CD34+ cells, as determined by two-sided Mann-Whitney U test. 6E – True age (x) versus age predicted based on composition-controlled CLP expression (y). The diagonal y = x is shown in red. 6F – the LMNA signature – co-variation of LMNA expression with ANXA1, TAGLN2, AHNAK, MYADM, TSPAN2 and VIM. 6G – heatmap of individual LMNA signature expression across the MEBEMP trajectory. Individual age and sex are color-coded on top. 6HLMNA signature vs AVP expression in HSCs (denoted by high AVP, center) and throughout MPP / MEBEMP (left) and lymphoid (right) differentiation. 6I - LMNA signature expression correlations between 39 technical & 17 biological replicates and their original samples, calculated across MEBEMPs (top) and CLPs (bottom). The diagonal y = x is shown in red. 6J - sync score correlations between 39 technical & 20 biological replicates and their original samples. All biological replicates were sampled 1 year following original blood sampling. The diagonal y = x is shown in red.
Extended Data Fig. 7
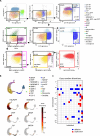
Extended Data Fig. 7. In-silico sorting scheme and copy number alterations.
7A – In-silico sorting scheme for a CD34-enriched PB scRNA sample. Each scatter plot demonstrates one or two virtual gates, based on total expression of gene signatures that were compiled using our cHSPC reference model. Representative cells shown belong to the 79 healthy donors comprising our Fig. 4 reference model (see Methods). Colors denote sorted cell states. 7B – Validation of in-silico sorting by annotated metacells. UMAP projection of the metacell model comprised of cells in A is shown, colored according to metacell annotation by marker genes (top), as in Extended Data Fig. 1C, and according to in-silico sorted state frequency, for each common cHSPC state (bottom). 7C – Distribution of copy number alterations (CNAs) identified by abnormal RNA expression over chromosomes (rows) and individuals (columns). Duplications and deletions are shown in red and blue, respectively. None of the individuals exhibited both duplication and deletion in the same chromosome. Individuals w/o CNAs are not shown.
Extended Data Fig. 8
Extended Data Fig. 8. MDS cHSPC composition groups.
8A – Distribution of composition abnormality scores across clinical diagnoses. The vertical grey line marks the 98th percentile score of healthy donors, defining the normal-like composition (group 1) and abnormal composition (groups 2-4) shown in Fig. 4b. 8B – In-silico sorted CLP frequencies across clinical diagnoses. Individuals are further separated by sex (male – left, female – right). Colors denote clinical diagnoses. Stars denote BH-adjusted significant difference from healthy donors of the same sex, determined by two-sided Mann-Whitney U test. 8C – Age and CBC indices values across healthy donors and cytopenia/MDS groups as in Fig. 4e. 8D – For each signature shown in Fig. 4e, biological replicate data is shown, comparing signature expression between the first and second sample. Individuals with insufficient cell counts for the population of interest were excluded. Linear fit across all individuals (n = 28 – MEBEMP-L MHC-II and S-phase signatures, n = 25 – BEMP early signature) is shown (dashed line), as well as the corresponding r- and (non-adjusted, two-sided) p-values.
Extended Data Fig. 9
Extended Data Fig. 9. MDS classification model, CLP-E-like state.
9A – Features used by the MDS classification model whose performance is shown in Fig. 4f. For each feature used by the model, SHAP analysis shows the estimated impact of the feature on classification for each individual. Colors denote individual feature values. 9B – same as A, but for an MDS classification model that does not use maximal CH VAF as a feature. 9C – ROC curve as in Fig. 4f, but for an MDS classification model that does not use maximal CH VAF as a feature. 9D – Definition of the CLP-E-like state. Distribution of the CLP signature is shown across all HSC/MPP and CLP cells (as defined using our in-silico sorting) in the Fig. 4 reference model, along with thresholds (red) defining an intermediate expression level (shaded grey). HSC/MPP and CLP cells exhibiting these intermediate CLP expression levels are considered to be in a CLP-E-like state.
Extended Data Fig. 10
Extended Data Fig. 10. Progression and remission case studies, abnormal composition reproducibility and stability of cytopenia patients after cHSPC sampling.
10A – Case study of disease progression. scRNA cHSPC samples were obtained for MDS patient N180 in 2021 (at which time he was diagnosed as cytopenic), 2022 and 2023, and a metacell model was constructed for each. Copy number variation (CNV) analysis is shown for each of these samples (top). Normalized gene expression (by the Fig. 4 reference model) for each metacell (row) and chromosomal region (column) is shown. This analysis revealed a small clone with trisomy 8 (red), and deletions in chromosomes 3 and 5 (del(5q)) (blue). Estimated clone size, as a percentage of total cHSPCs, is specified for each sample. Cell-state frequencies for cells with and without identified CNVs are shown on the right of each CNV analysis. The number of cells in each group is indicated. Longitudinal hemoglobin counts (bottom) are also shown, with grey vertical lines denoting dates of scRNA sampling. 10B – Case study of remission. Same as A, but for MDS del5q patient N211, sampled before and after lenalidomide treatment (bottom, shaded grey). Initial CNV analysis of her scRNA data revealed a very large clone with del(5q), which could not be detected following treatment with lenalidomide. 10C – Recurring abnormal cell state frequencies. For each of 6 individuals, cHSPC compositions (obtained by in-silico sorting) are shown for two different scRNA samples, demonstrating recurrence of abnormal cHSPC state frequencies (N192 – high BEMP, N235 and N281 – high GMP-L, N204 and N165 – high CLP, N78 – low CLP). 10D – Distribution of follow-up intervals, between cHSPC sampling and most recent available CBC results, across 29 (out of 33) patients with cytopenia. Boxplot indicates first, second and third quartiles. 10E – As a positive control for CBC instability in MDS, earlier CBC results were retrieved for MDS patients, targeting an interval of approximately 600 days between 1st and 2nd CBC measurements, to reflect the follow-up duration observed in patients with cytopenia. Shown here is the distribution of these simulated follow-up intervals for patients with MDS (similar to D). Treated patients and those with follow-up intervals <200 days were excluded from this analysis. 10F – Change in RDW values over follow-up intervals shown in D and E, used as a proxy for disease progression. Colors denote clinical diagnosis at cHSPC sampling.

References

    1. Osgood, E. E. Normal hematologic standards. Arch. Intern. Med.56, 849–863 (1935).
    1. Cohen, N. M. et al. Personalized lab test models to quantify disease potentials in healthy individuals. Nat. Med.10.1038/S41591-021-01468-6 (2021). - PubMed
    1. Cohen, K. S. et al. Circulating CD34+ progenitor cell frequency is associated with clinical and genetic factors. Blood121, e50–e56 (2013). - PMC - PubMed
    1. Mende, N. & Laurenti, E. Hematopoietic stem and progenitor cells outside the bone marrow: where, when, and why. Exp. Hematol.104, 9–16 (2021). - PubMed
    1. Ainciburu, M. et al. Uncovering perturbations in human hematopoiesis associated with healthy aging and myeloid malignancies at single-cell resolution. eLife12, e79363 (2023). - PMC - PubMed