. 2025 Oct;62(10):13736-13747.
doi: 10.1007/s12035-025-05139-2. Epub 2025 Jun 27.

Macluraparishin C Enhances Neuroprotection Against Oxidative Stress-Induced Neurodegeneration by Activating the Antioxidant/MAPK Signaling Pathway

Affiliations

Macluraparishin C Enhances Neuroprotection Against Oxidative Stress-Induced Neurodegeneration by Activating the Antioxidant/MAPK Signaling Pathway

Md Shiblee Sadik Sabuj et al. Mol Neurobiol. 2025 Oct.

Abstract

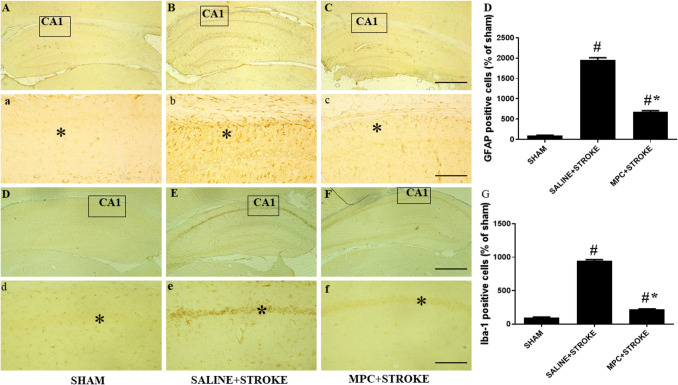
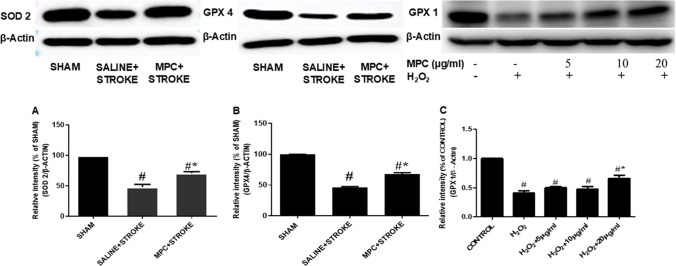
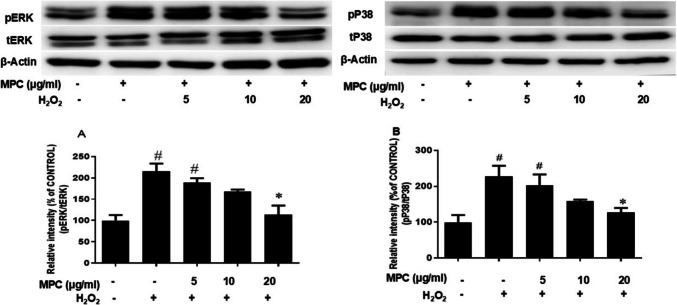
Oxidative stress plays a critical role in the development and progression of neurodegenerative diseases through the induction of neuronal injury and apoptosis. Macluraparishin C (MPC) is a novel parishin compound with identified potent neuroprotection, whose molecular mechanisms have not been clarified yet. The present research aims to explore the neuroprotective function of MPC in the context of the bilateral common carotid artery (BCCA) occlusion-induced transient global cerebral ischemia (tGCI) in gerbils, along with hydrogen peroxide (H2O2)-induced oxidative stress in SH-SY5Y cells. The neuroprotective capability of MPC was appraised by conducting several assays like cell viability, lactase dehydrogenase (LDH) assay, quantitative real-time PCR, Western blot, immunohistochemistry (IHC), cresyl violet (CV), and fluoro-jade B (FJB) staining. The pretreatment with MPC has significantly reduced the number of microglia and astrocytes present in the hippocampal CA1 area, as well as the cell death of neurons in gerbils after tGCI. Moreover, MPC pretreatment downregulates the protein expressions of the MAPK cascade, including ERK, JNK, and p38, and regulates antioxidant enzymes, such as SOD2, GPX1, GPX4, and CAT, in both hippocampi and SH-SY5Y cells. In the SH-SY5Y cell line, MPC decreased neurotoxicity induced by H2O2 by lessening LDH release and enhancing neuronal stress marker genes like brain-derived neurotrophic factor (BDNF). These findings suggest that MPC may protect neurons by boosting antioxidant/MAPK pathways, showing potential for treating oxidative stress-related neurodegenerative diseases.

Keywords: Antioxidant; MAPK; Macluraparishin C; Neurodegeneration; Oxidative stress; Transient global cerebral ischemia.


Conflict of interest statement

Declarations. Ethics Approval: The study protocols were carried out following relevant guidelines and regulations approved by the animal welfare regulations of the Institutional Animal Care and Use Committee (approval no. CBNU-2020–003) of the Jeonbuk National University Laboratory Animal Center in South Korea and in compliance with the ARRIVE guidelines. Consent for Publication: Not applicable. Conflict of Interest: The authors declare no competing interests.

Figures

Fig. 1
Fig. 1
Effect of MPC on NeuN-positive cells in the CA1 area. NeuN immunoreactive cells were found in three groups: (A) sham group at 10 × (a) and 200 ×, (B) tGCI-induced stroke with saline at 200 ×, and (C) tGCI-induced stroke with MPC treatment (20 mg/kg) at 10 × and 200 ×. The squares in the CA1 areas indicate the positions of the high magnification images in (a–c). Scale bar, 1 mm (AC) or 50 µm (a–c). In the saline group, most CA1 pyramidal cells (asterisks) showed minimal NeuN immunoreactivity, while the sham and MPC groups exhibited strong NeuN positivity in CA1 pyramidal cells. (D) A graph shows the percentage of NeuN-positive cells compared to the sham group, with data presented as mean ± SEM (n = 3 per group) and analyzed using one-way ANOVA and Tukey post hoc test; (#p < 0.05) indicates significance vs. sham, and (*p < 0.05) indicates significance vs. stroke
Fig. 2
Fig. 2
Effects of MPC on CV-positive cells and FJB-positive cells in the hippocampal CA1 area. CV-positive cells were observed in the following groups: (A) sham group at 10 × (a) and 200 ×, (B) tGCI-induced stroke with saline at 10 × (b) and 200 ×, and (C) tGCI-induced stroke with MPC (20 mg/kg) at 10 × (c) and 200 ×. The squares in the CA1 areas indicate the positions of the high magnification images in (a–c and e–g). Scale bar, 1 mm (A–C and E–G) or 50 µm (a–c and e–g). A significant reduction in CV-positive cells was noted in the CA1 region of the hippocampus (asterisks) compared to both the sham and MPC groups. (D) The graph shows the percentage of CV-positive cells relative to the sham group. F-J B-positive cells were assessed in (E) sham group at 10 × (e) and 200 ×, (F) tGCI-induced stroke with saline at 10 × (f) and 200 ×, and (G) tGCI-induced stroke with MPC at 10 × (g) and 200 ×. An increase in F-J B-positive cells was observed in the CA1 region (asterisks) of the saline stroke group compared to the sham and MPC groups. (H) The graph depicts the percentage of F-J B-positive cells relative to the sham group. Data are expressed as mean ± SEM, n = 3 per group, analyzed using one-way ANOVA with Tukey post hoc test; (#p < 0.05) indicates significance compared to sham, and (*p < 0.05) indicates significance compared to stroke
Fig. 3
Fig. 3
Effect of MPC on Iba-1-positive microglia and GFAP-positive astrocytes in the CA1 area. GFAP-positive astrocytes are observed in (A) the sham group at 10 × (a) and 200 × magnification, (B) the tGCI-induced stroke with the saline group at 200 × (b), and (C) the tGCI-induced stroke with MPC treatment (20 mg/kg) at 10 × and 200 × (c). The squares in the CA1 areas indicate the positions of the high magnification images in (a–c and e–g). Scale bar, 1 mm (A–C and E–G) or 50 µm (a–c and e–g). In the saline group, GFAP-positive astrocytes show hypertrophy in the CA1 region’s stratum pyramidale (asterisks) compared to the sham and MPC groups. (D) A graph shows the percentage of GFAP-positive cells relative to the sham group. Iba-1 microglia are shown in (E) the sham group at 10 × (e) and 200 ×, (F) the tGCI-induced stroke with saline group at 200 × (f), and (G) the tGCI-induced stroke with MPC treatment at 10 × and 200 × (g). The saline group also exhibits hypertrophy of Iba-1-positive microglia in the CA1 region (asterisks) compared to the sham and MPC groups. (H) A graph displays the percentage of Iba-1-positive cells relative to the sham group. Data are presented as mean ± SEM, with n = 3 per group, analyzed using one-way ANOVA and Tukey post hoc test; (#p < 0.05) indicates significance compared to the sham group, while (*p < 0.05) indicates significance compared to the stroke group
Fig. 4
Fig. 4
Effect of MPC on the expression of the phosphorylated form of ERK, p38, and pJNK protein in tGCI-induced hippocampus. Pretreatment with MPC reduced the levels of pERK, pP38, and pJNK proteins in the hippocampus. Data are presented as mean ± SEM (n = 3 per group) and analyzed using one-way ANOVA with Tukey post hoc test; (#p < 0.05) indicates significance vs. sham group, and (*p < 0.05) indicates significance vs. stroke group
Fig. 5
Fig. 5
Effect of MPC on the expression of SOD 2, and GPX 4 enzymes in tGCI-induced hippocampus as well as GPX 1 enzyme in SH-SY5Y cells. Pretreatment with MPC boosted the expression of SOD 2 and GPX 4 in the hippocampus. Besides, the relative intensity of GPX 1 in SH-SY5Y cells induced by H2O2 enhanced after MPC pretreatment. Data are presented as mean ± SEM (n = 3 per group) and analyzed using one-way ANOVA with Tukey post hoc test; (#p < 0.05) indicates significance vs. sham group or control group and (*p < 0.05) indicates significance vs. stroke group or H2O2 treatment
Fig. 6
Fig. 6
Effect of MPC on the cell viability, LDH accumulation, SOD, and CAT antioxidant enzyme expression as well as neuronal marker BDNF protein. Cell viability in H2O2-treated SH-SY5Y cells was assessed using the MTT assay (A), LDH release (B) was measured to evaluate oxidative stress and expression levels of neuronal marker C BDNF, antioxidant enzymes, specifically D SOD and E CAT were assessed using quantitative real-time PCR. Results are presented as mean ± SEM (n = 3 per group) and analyzed with one-way ANOVA and Tukey post hoc test; (#p < 0.05) indicates significance vs. control, while (*p < 0.05) indicates significance vs. H2O2 treatment
Fig. 7
Fig. 7
Effect of MPC on the expression of the phosphorylated form of pERK and pP38 protein in SH-SY5Y cells. The relative intensity of pERK (A) and pP38 (B) proteins in SH-SY5Y cells induced by H2O2 decreased after MPC pretreatment. Data are presented as mean ± SEM (n = 3 per group) and analyzed using one-way ANOVA with Tukey post hoc test; (#p < 0.05) indicates significance vs. control, and (*p < 0.05) indicates significance vs. H2O2

References

    1. Lee RH, Lee MH, Wu CY, e Silva AC, Possoit HE, Hsieh T-H, Minagar A, Lin HW (2018) Cerebral ischemia and neuroregeneration. Neural regeneration research 13 (3):373–385 - PMC - PubMed
    1. Harukuni I, Bhardwaj A (2006) Mechanisms of brain injury after global cerebral ischemia. Neurol Clin 24(1):1–21 - PubMed
    1. Yoshikawa T, Naito Y (2002) What is oxidative stress? Japan medical association journal 45(7):271–276
    1. Xu Q-L, Wu J (2021) Effects of Txk-mediated activation of NF-κB signaling pathway on neurological deficit and oxidative stress after ischemia-reperfusion in rats. Mol Med Rep 24(1):1–10 - PMC - PubMed
    1. Chen H, Yoshioka H, Kim GS, Jung JE, Okami N, Sakata H, Maier CM, Narasimhan P, Goeders CE, Chan PH (2011) Oxidative stress in ischemic brain damage: mechanisms of cell death and potential molecular targets for neuroprotection. Antioxid Redox Signal 14(8):1505–1517 - PMC - PubMed

MeSH terms