. 2025 Jun 27;22(1):167.
doi: 10.1186/s12974-025-03495-3.

N-Lactoyl-Phenylalanine modulates lipid metabolism in microglia/macrophage via the AMPK-PGC1α-PPARγ pathway to promote recovery in mice with spinal cord injury

Affiliations

N-Lactoyl-Phenylalanine modulates lipid metabolism in microglia/macrophage via the AMPK-PGC1α-PPARγ pathway to promote recovery in mice with spinal cord injury

Weiyang Ying et al. J Neuroinflammation. .

Abstract

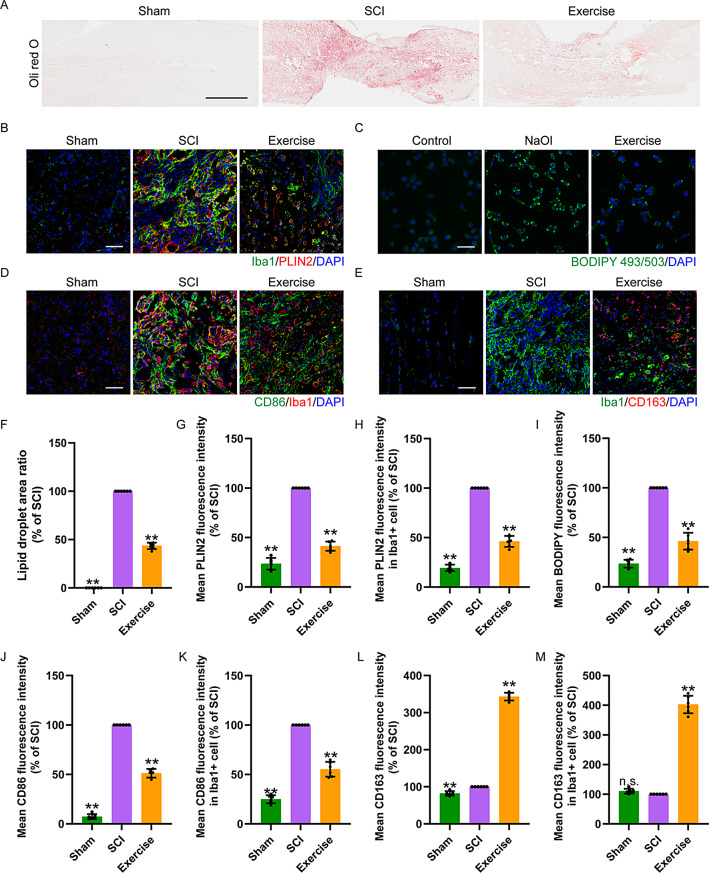
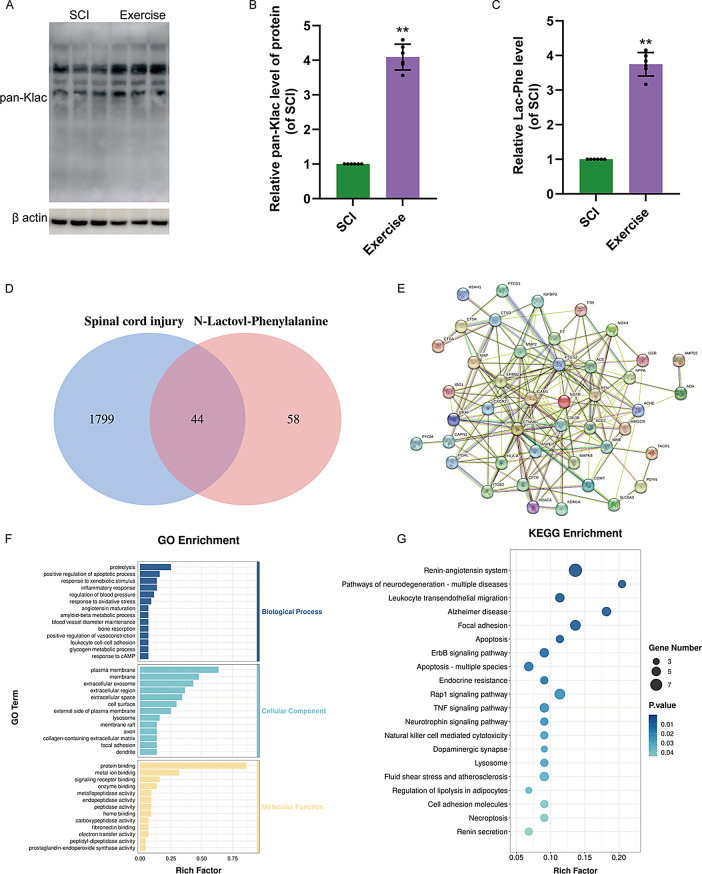
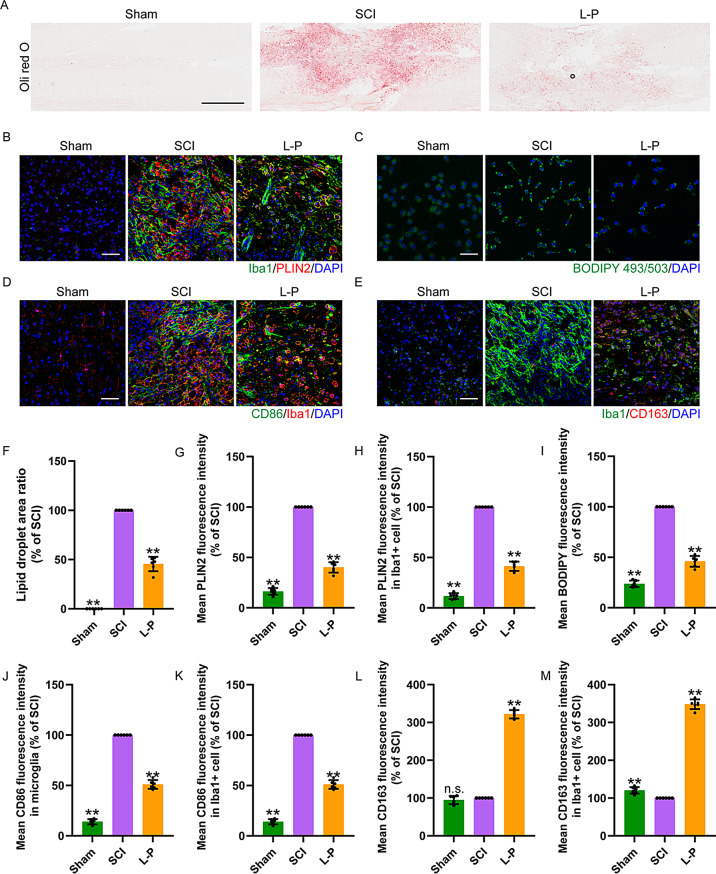
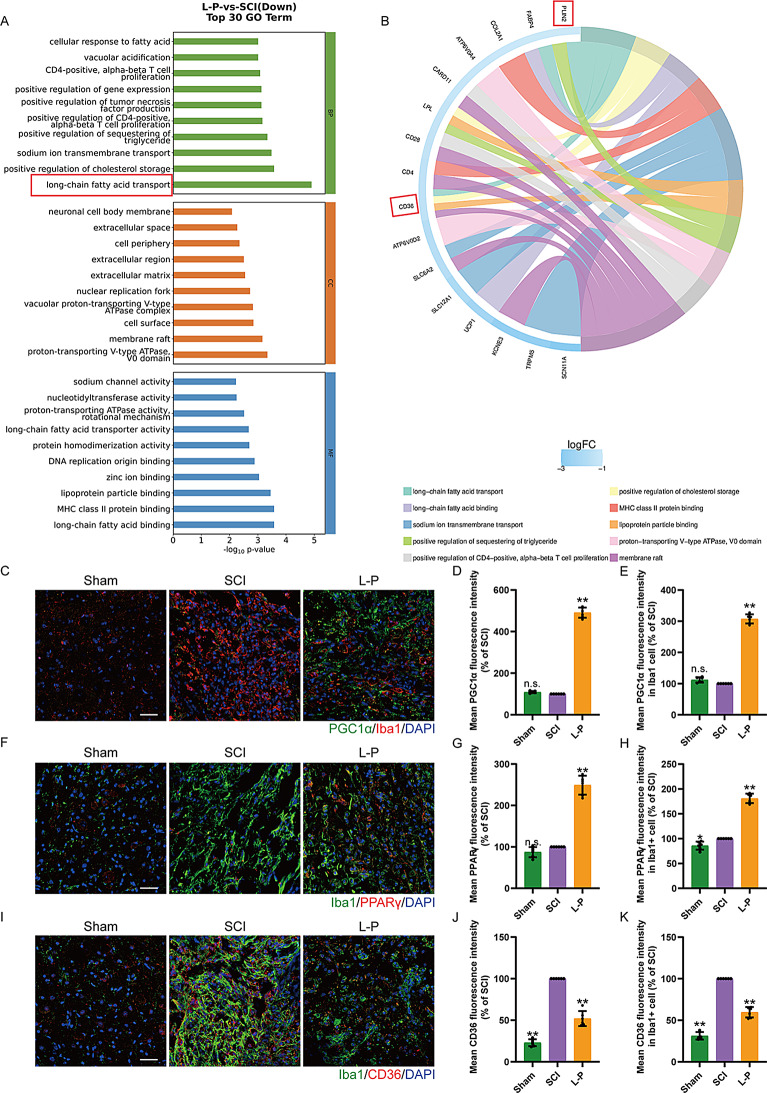
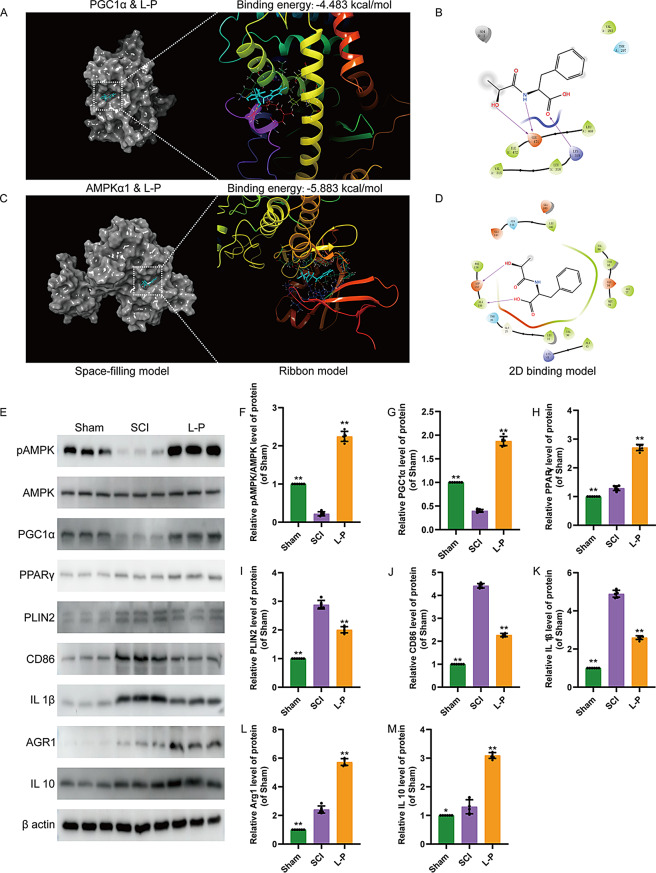
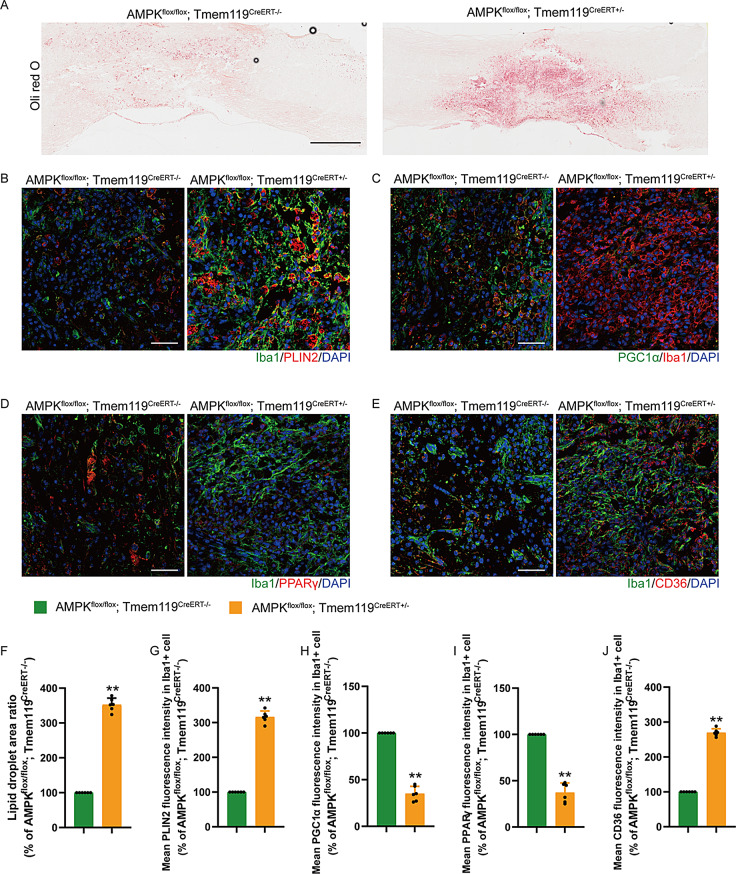
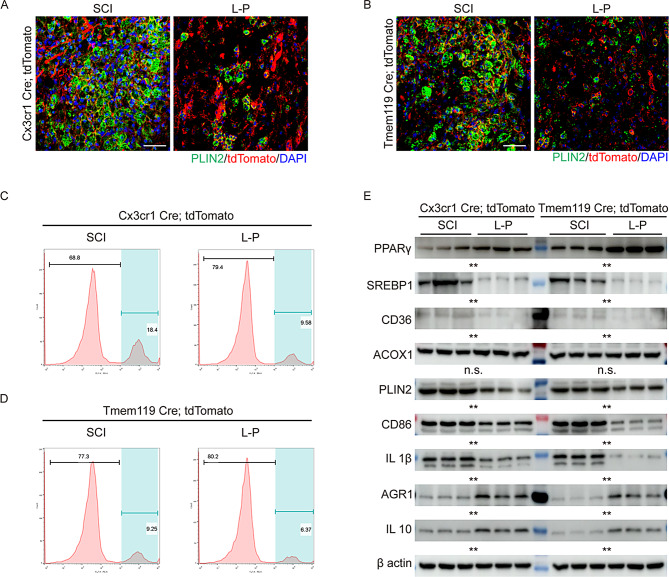
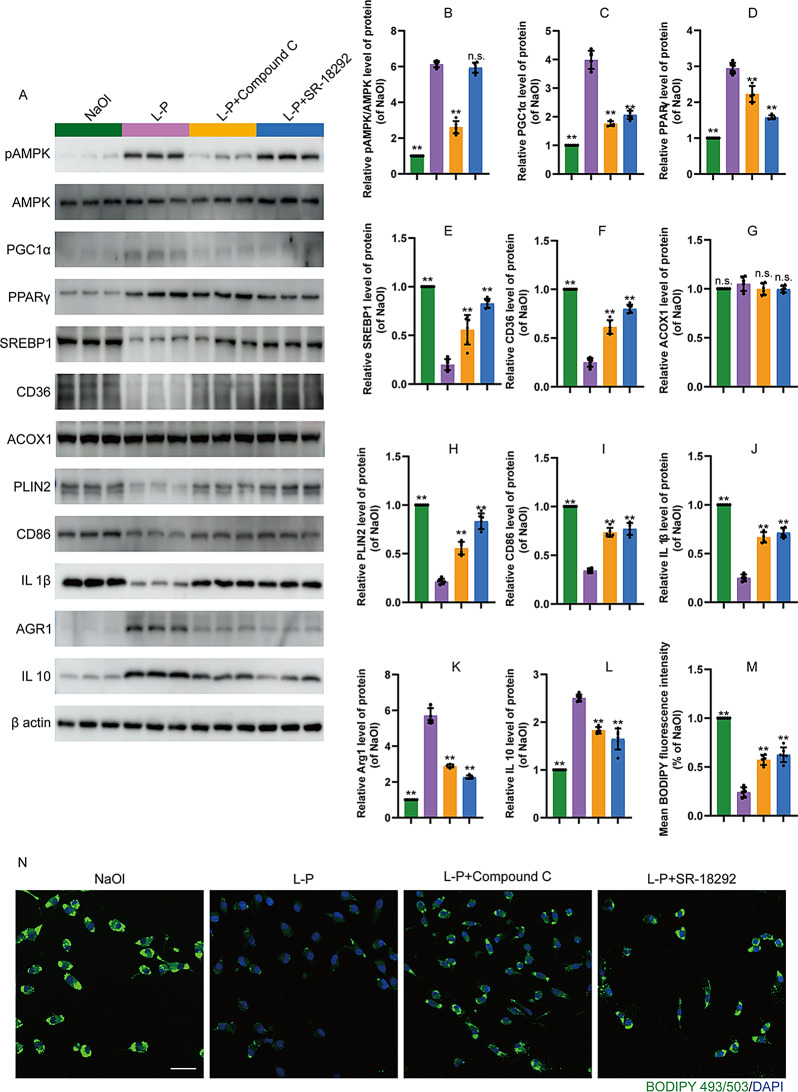
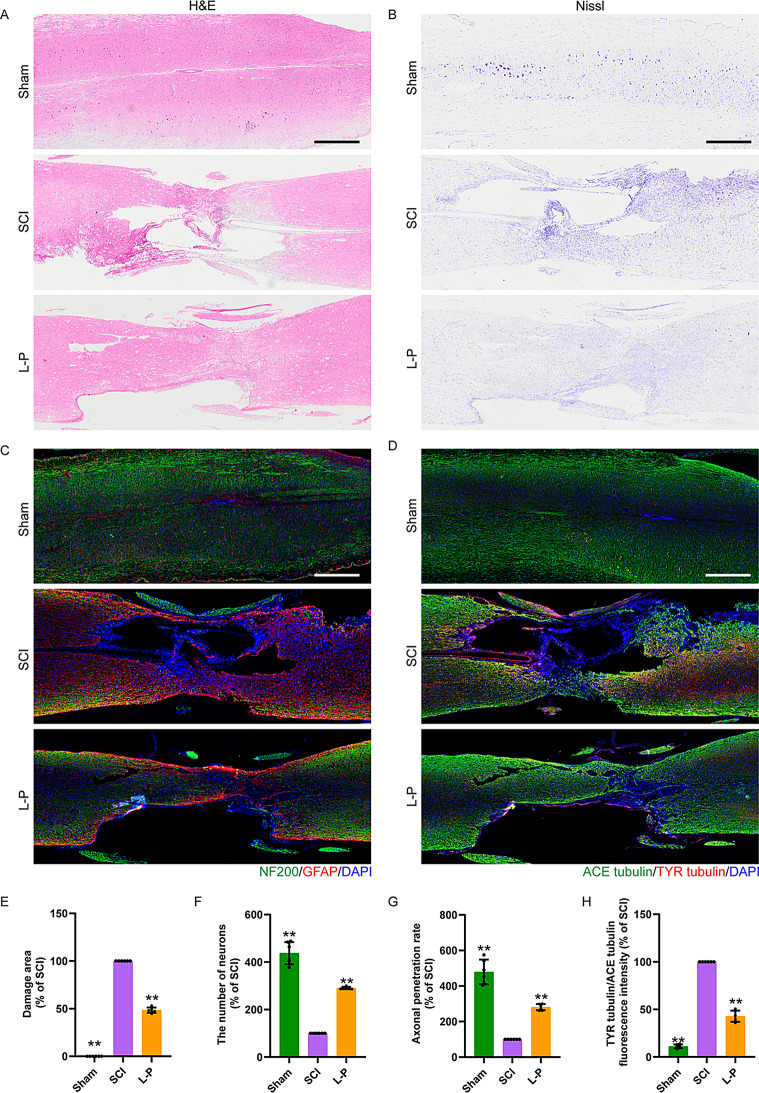
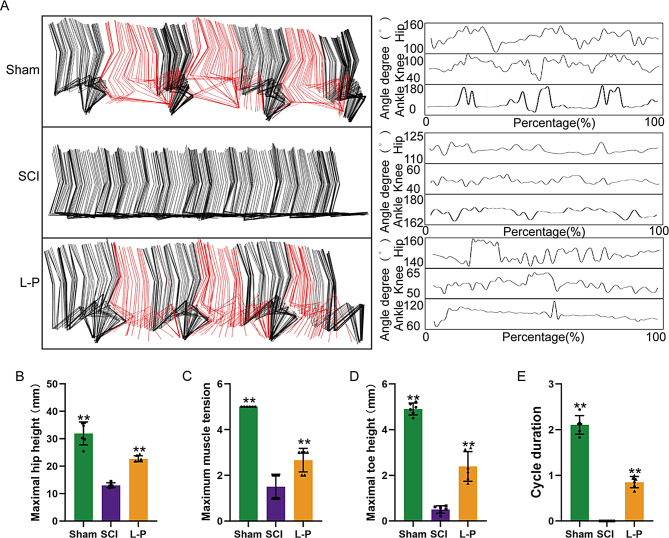
The accumulation of lipids in microglia/macrophage-induced inflammation exacerbation represents a pivotal factor contributing to secondary injury following spinal cord injury (SCI). N-Lactoyl-Phenylalanine (L-P), a metabolic byproduct of exercise, exhibits the capacity to regulate carbohydrate and lipid metabolism and may serve as a potential regulator of lipid metabolism in microglia/macrophage. This study investigates the role of L-P in modulating lipid homeostasis in microglia/macrophage and its therapeutic implications for SCI recovery. By establishing a mouse model of SCI, we confirmed that L-P administration markedly altered lipid metabolism in microglia/macrophage. This metabolic reprogramming was mediated through the activation of the AMPK-PGC1α-PPARγ signaling pathway, which plays a crucial role in regulating cellular energy metabolism and inflammatory responses. Our findings demonstrate that L-P treatment enhances the lipid metabolic capacity of microglia/macrophage, thereby attenuating neuroinflammation and promoting tissue repair after injury. Moreover, the polarization of microglia/macrophage shifts toward the anti-inflammatory M2 phenotype, providing substantial support for the regenerative process of the injured spinal cord. Functional analysis revealed that mice treated with L-P exhibited significantly improved motor function compared to the control group. Collectively, these results underscore the therapeutic potential of L-P in SCI and suggest its utility as a metabolic intervention strategy by modulating microglia/macrophage lipid metabolism to accelerate recovery.


Conflict of interest statement

Declarations. Ethics statement: The animal study was reviewed and approved by Animal Care and Use Committee of Wenzhou Medical College (Wydw2024–0539). Competing interests: The authors declare no competing interests.

Figures

Fig. 1
Fig. 1
Exercise accelerates lipid metabolism in Iba + cells and inhibits inflammation. (A) Oli Red O staining of each group, scale bar: 1000 μm. (B) Immunofluorescence expression of Iba1 (green), PLIN2 (red) and DAPI (blue) in each group, scale bar: 50 μm. (C) Immunofluorescence expression of BODIPY 493/503 (green) and DAPI (blue) in each group, scale bar: 50 μm. (D) Immunofluorescence expression of CD86 (green), Iba1 (red) and DAPI (blue) in each group, scale bar: 50 μm. (E) Immunofluorescence expression of Iba1 (green), CD163 (red) and DAPI (blue) in each group, scale bar: 50 μm. (F) Statistical analysis of Lipid droplet area ratio in each group. (G, I, J, L) Statistical analysis of PLIN2, BODIPY 493/503, CD86 and CD163 expression in each group. (H, K, M) Statistical analysis of PLIN2, CD86 and CD163 expression in Iba1 + cell in each group. * represents P < 0.05. ** represents P < 0.01 vs. the SCI group. n.s. stands for no statistical significance. The data are represented as the mean ± SD (n = 6)
Fig. 2
Fig. 2
The Basis for Selecting L-P and Network Pharmacology Analysis of L-P. (A) Western blotting showing the expression of pan-Klac in each group. (B) Quantitative analysis of pan-Klac protein expression. (C) Quantitative analysis of pan-Klac protein expression. (D) Common targets for both SCI and L-P. (E) The Protein-Protein Interaction Network of L-P and SCI. (F) GO enrichment analysis of the candidate targets for L-P and SCI. (G) KEGG enrichment analysis of the candidate targets for L-P and SCI. ** represents P < 0.01 vs. the SCI group. The data are represented as the mean ± SD (n = 6)
Fig. 3
Fig. 3
L-P accelerates lipid metabolism in Iba + cells and inhibits inflammation. (A) Oli Red O staining of each group, scale bar: 1000 μm. (B) Immunofluorescence expression of Iba1 (green), PLIN2 (red) and DAPI (blue) in each group, scale bar: 50 μm. (C) Immunofluorescence expression of BODIPY 493/503 (green) and DAPI (blue) in each group, scale bar: 50 μm. (D) Immunofluorescence expression of CD86 (green), Iba1 (red) and DAPI (blue) in each group, scale bar: 50 μm. (E) Immunofluorescence expression of Iba1 (green), CD163 (red) and DAPI (blue) in each group, scale bar: 50 μm. (F) Statistical analysis of Lipid droplet area ratio in each group. (G, I, J, L) Statistical analysis of PLIN2, BODIPY 493/503, CD86 and CD163 expression in each group. (H, K, M) Statistical analysis of PLIN2, CD86 and CD163 expression in Iba1 + cell in each group. * represents P < 0.05. ** represents P < 0.01 vs. the SCI group. n.s. stands for no statistical significance. The data are represented as the mean ± SD (n = 6)
Fig. 4
Fig. 4
The regulatory pathways of N-Lactoyl-Phenylalanine screened based on transcriptome. (A) Gene Ontology (GO) enrichment analysis of transcriptome sequencing. (B) GO enrichment analysis and string diagrams. (C) Immunofluorescence expression of PGC1α (green), Iba1 (red) and DAPI (blue) in each group, scale bar: 50 μm. (D) Statistical analysis of PGC1α expression in each group. (E) Statistical analysis of PGC1α expression in Iba1 + cell in each group. (F) Immunofluorescence expression of Iba1 (green), PPARγ (red) and DAPI (blue) in each group, scale bar: 50 μm. (G) Statistical analysis of PPARγ expression in each group. (H) Statistical analysis of PPARγ expression in Iba1 + cell in each group. (I) Immunofluorescence expression of Iba1 (green), CD36 (red) and DAPI (blue) in each group, scale bar: 50 μm. (J) Statistical analysis of CD36 expression in each group. (K) Statistical analysis of CD36 expression in Iba1 + cell in each group. * represents P < 0.05. ** represents P < 0.01 vs. the SCI group. n.s. stands for no statistical significance. The data are represented as the mean ± SD (n = 6)
Fig. 5
Fig. 5
N-Lactoyl-Phenylalanine regulates the lipid metabolism of Iba + cells via the AMPK/PGC1α/PPARγ pathway. (A) The space-filling models and ribbon models of L-P in complex with PGC1α. (B) The 2D binding models between L-P and PGC1α complex. (C) The space-filling models and ribbon models of L-P in complex with AMPK. (D) The 2D binding models between L-P and AMPK complex. (E) Western blotting showing the expression of pAMPK, AMPK, PGC1α, PAPRγ, PLIN2, CD86, IL 1β, Arg1 and IL 10 in each group. (F-M) Quantitative analysis of pAMPK/AMPK, PGC1α, PAPRγ, PLIN2, CD86, IL 1β, Arg1 and IL 10 protein expression. * represents P < 0.05. ** represents P < 0.01 vs. the SCI group. The data are represented as the mean ± SD (n = 6)
Fig. 6
Fig. 6
Conditional knockout mice of AMPK in microglia verified that L-P regulates spinal cord lipid metabolism via the AMPK/PGC1α/PPARγ pathway. (A) Oli Red O staining of each group, scale bar: 1000 μm. (B) Immunofluorescence expression of Iba1 (green), PLIN2 (red) and DAPI (blue) in each group, scale bar: 50 μm. (C) Immunofluorescence expression of PGC1α (green), Iba1 (red) and DAPI (blue) in each group, scale bar: 50 μm. (D) Immunofluorescence expression of Iba1 (green), PPARγ (red) and DAPI (blue) in each group, scale bar: 50 μm. (E) Immunofluorescence expression of Iba1 (green), CD36 (red) and DAPI (blue) in each group, scale bar: 50 μm. (F) Statistical analysis of Lipid droplet area ratio in each group. (G, H, I, J) Statistical analysis of PLIN2, PGC1α, PPARγ and CD36 expression in Iba1 + cell in each group. ** represents P < 0.01 vs. the SCI group. The data are represented as the mean ± SD (n = 6)
Fig. 7
Fig. 7
Identification of the lipid metabolism effects of L-P on microglia and macrophages based on lineage tracing gene mice. (A) Immunofluorescence expression of PLIN2 (green), tdTomato (red, tracer mononuclear/macrophage cells) and DAPI (blue) in each group, scale bar: 50 μm. (B) Immunofluorescence expression of PLIN2 (green), tdTomato (red, tracer microglia) and DAPI (blue) in each group, scale bar: 50 μm. (C) Flow sort tdTomato-positive mononuclear/macrophage cells from each group. (D) Flow sort tdTomato-positive microglia from each group. (E) Western blotting showing the expression of PAPRγ, SREBP1, CD36, PLIN2, CD86, IL 1β, Arg1 and IL 10 in each group. ** represents P < 0.01 vs. the L-P group. The data are represented as the mean ± SD (n = 6)
Fig. 8
Fig. 8
The inhibition of AMPK and PGC1α was used to study the role of the AMPK/PGC1α/PPARγ pathway in lipid metabolism and inflammation. (A) Western blotting showing the expression of pAMPK, AMPK, PGC1α, PAPRγ, SREBP1, CD36, PLIN2, CD86, IL 1β, Arg1 and IL 10 in each group. (B-L) Quantitative analysis of pAMPK/AMPK, PGC1α, PAPRγ, SREBP1, CD36, PLIN2, CD86, IL 1β, Arg1 and IL 10 protein expression. (M) Statistical analysis of BODIPY493/503 expression in each group. (N) Immunofluorescence expression of BODIPY493/503 (green) and DPAI (blue) in each group, scale bar: 50 μm. * represents P < 0.05. ** represents P < 0.01 vs. the L-P group. The data are represented as the mean ± SD (n = 6)
Fig. 9
Fig. 9
L-P promotes tissue repair and axonal protection in SCI mice. (A) H&E staining of each group, scale bar: 1000 μm. (B) Nissl staining of each group, scale bar: 1000 μm. (C) Immunofluorescence expression of NF200 (green), GFAP (red) and DAPI (blue) in each group, scale bar: 1000 μm. (D) Immunofluorescence expression of ACE tubulin (green), TYR tubulin (red) and DAPI (blue) in each group, scale bar: 1000 μm. (E) Statistical analysis of damage area in each group. (F) Statistical analysis of number of neurons in each group. (G) Statistical analysis of axonal penetration rate in each group. (F) Statistical analysis of ACE tubulin/TYR tubulin in each group. ** represents P < 0.01 vs. the SCI group. The data are represented as the mean ± SD (n = 6)
Fig. 10
Fig. 10
Figure 10. L-P promotes the recovery of motor function in SCI mice. (A) At 28 days after SCI, the hindlimb movement of mice was analyzed by visual bar graph and the joint movement trajectory was detected visually. (B) Maximum height of toes off the ground. (C) Maximum height of hips above the ground. (D) Maximum muscle strength. (E) Motor cycle recording. ** represents P < 0.01 vs. the SCI group. The data are represented as the mean ± SD (n = 6)

Similar articles

References

    1. Fouad K, Popovich PG, Kopp MA, Schwab JM. The neuroanatomical-functional paradox in spinal cord injury. Nat Reviews Neurol. 2021;17:53–62. - PMC - PubMed
    1. Troletti CD, Enzmann G, Chiurchiù V, Kamermans A, Tietz SM, Norris PC, Jahromi NH, Leuti A, van der Pol SMA, Schouten M, et al. Pro-resolving lipid mediator Lipoxin A attenuates neuro-inflammation by modulating T cell responses and modifies the spinal cord lipidome. Cell Rep. 2021;35:109201. - PMC - PubMed
    1. Li Y, Ritzel RM, Khan N, Cao TX, He JY, Lei ZF, Matyas JJ, Sabirzhanov B, Liu S, Li H, et al. Delayed microglial depletion after spinal cord injury reduces chronic inflammation and neurodegeneration in the brain and improves neurological recovery in male mice. Theranostics. 2020;10:11376–403. - PMC - PubMed
    1. Marschallinger J, Iram T, Zardeneta M, Lee SE, Lehallier B, Haney MS, Pluvinage JV, Mathur V, Hahn O, Morgens DW, et al. Lipid-droplet-accumulating microglia represent a dysfunctional and Proinflammatory state in the aging brain. Nat Neurosci. 2020;23:194–208. - PMC - PubMed
    1. Herzig S, Shaw RJ. AMPK: guardian of metabolism and mitochondrial homeostasis. Nat Rev Mol Cell Biol. 2018;19:121–35. - PMC - PubMed

MeSH terms

Substances

LinkOut - more resources