. 2025 Aug;63(4):e70021.
doi: 10.1002/dvg.70021.

Tracing Early Migratory Neurons in the Developing Nose Using Contactin-2 (Cntn2) CreERT2

Affiliations

Tracing Early Migratory Neurons in the Developing Nose Using Contactin-2 (Cntn2) CreERT2

Enrico Amato Jr et al. Genesis. 2025 Aug.

Abstract

Neuronal migration during embryonic development is a fundamental process. In the developing nose of rodents, neurons that form during early neurogenic waves in the olfactory placode leave this structure to migrate toward or into the developing brain as part of the migratory mass. This mass includes gonadotropin-releasing hormone-1 (GnRH-1) neurons, pioneer/terminal nerve (TN) neurons, as well as neural crest-derived olfactory glial cells called olfactory ensheathing cells. There have been a limited number of molecular markers available to effectively trace and functionally manipulate the early migratory neurons that originate in the olfactory region. Contactin-2 (Cntn2), also known as transiently expressed axonal surface glycoprotein-1 (TAG-1), has been used to label various developing neuronal populations, including the commissural neurons of the spinal cord, motor neurons, and TN neurons. Previous single-cell RNA sequencing analyses of the developing olfactory system have identified Cntn2 expression in the TN, suggesting that Cntn2 is a suitable molecular marker for studying nasal migratory neurons. To trace Cntn2 expression in the developing olfactory system, we generated an inducible Cntn2CreERT2 mouse line. In this study, we outline how this mouse line can serve as an effective tool for time-controlled chimeric manipulation of specific neuronal populations of interest.

Keywords: Contactin‐2 (Cntn2); GnRH neurons; migratory mass; olfactory development; spinal cord; terminal nerve.


Figures

FIGURE 1
FIGURE 1
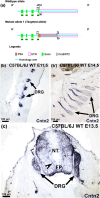
Strategy for generation of Cntn2CreERT2 mice and expression of Cntn2 in the Spinal Cord. (a) Construct used in the creation of Cntn2CreERT2 mice. Based on strategy report provided by Cyagen. (b,b′) Parasagittal sections of E11.5 and E14.5 C57BL/6J WT embryos immunostained for Cntn2, highlighting expression in the dorsal root ganglia (DRG). (c) In the transverse section of an E13.5 embryo, Cntn2 is expressed by the DRG and within the commissural neurons (notched arrowhead), passing through the floorplate (FP) of the neural tube (NT). Scale bars in (b, b′, c), 100 μm.
FIGURE 2
FIGURE 2
Cntn2CreERT2 recombination in the spinal cord overlaps with Cntn2 immunoreactivity. (a) Immunofluorescence for Cntn2 (Contactin 2, green) on transverse E12.5 C57 BL/6J WT tissue reveals the dorsal root ganglion (DRG) proximal to the neural tube (NT) are positive. The commissural neurons are highlighted by Cntn2 immunostaining, passing through the floor plate (FP) (notched arrowhead). (b) Cntn2CreERT2 +/−/Ai14+/− mice were injected with tamoxifen at E11.5 and collected at E12.5. (c‐c”, d‐d”) Double Immunofluorescent staining against Cntn2 (green) and tdTomato (magenta) on parasagittal and transverse E12.5 Cntn2CreERT2 +/−/Ai14+/− animals highlights traced neurons immunopositive for Cntn2 in the DRGs (arrowheads). Scale bars in (a, c, d) 100 μm; (c′, c″, d′, d″), 50 μm.
FIGURE 3
FIGURE 3
Contactin‐2 (Cntn2) is expressed by neurons of the nasal migratory mass. (a–d) Developmental time‐course of immunohistochemistry against Cntn2 on C57BL/6J WT mice. (a,a′) At E10.5, Cntn2 expression is shown in the migratory pioneer/TN neurons within the migratory mass (MM) emerging from the olfactory placode (OP) and proximal to the developing forebrain (FB) indicated by the black arrowheads. (b,b′) Cntn2 expression at E11.5 is still present in the pioneer/TN neurons migrating away from the olfactory epithelium (OE). (c,c′) At E12.5, Cntn2 expression is seen in a select group of neurons, labelling cell bodies and fibers outside of the vomeronasal organ (VNO) and adjacent to the forebrain junction (FBJ). (d,d′) Observing Cntn2 expression at E13.5 shows neurons leaving the VNO and projecting toward the brain, passing the olfactory bulb (OB). Scale bars in (a′, b′) 25 μm; (c′, d′) 50 μm; (a, b) 100 μm; (c, d) 250 μm.
FIGURE 4
FIGURE 4
Transient immunoreactivity of Cntn2 in the GnRH‐1 neurons within the developing olfactory system. (a–c) Developmental time‐course of GnRH‐1 (green, arrowheads) and Cntn2 (magenta, arrows) immunoreactivity in the developing olfactory system at E11.5, E12, and E13.5. (a, a′) At E11.5, three distinct populations of neurons can be observed, GnRH‐1 neurons negative for Cntn2, Cntn2 neurons negative for GnRH‐1 and GnRH‐1 neurons that express Cntn2 (notched arrowheads). The three distinct populations of neurons are not migrating and are within the vomeronasal organ (VNO). (b, b′) Visualizing at E12.5, the three groups of neurons migrate out of the VNO past the olfactory epithelium (OE) and toward the olfactory bulb (OB). The fibers of the terminal nerve (TN) are immunoreactive for Cntn2. (c,c′) At E13.5, the majority of migratory neurons have left the VNO and have now invaded the brain. The Cntn2+ TN can be observed projecting into the basal forebrain (BFB). Scale bars in (a′–c′) 50 μm; (a,c) 100 μm.
FIGURE 5
FIGURE 5
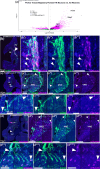
Contactin‐2 (Cntn2) as a genetic entry point to manipulate the terminal nerve: (a) Volcano plot comparing enriched genes of the sorted migratory pioneer/TN neurons with all unsorted neurons. (b–d) Developmental time‐course of Cntn2 immunoreactivity in the developing vomeronasal organ (VNO) and migratory TN from E11.5‐E13.5 using Prokr2Cre+/−/Ai14+/− mice. Immunostaining for Cntn2 (green) and Prokr2 lineage tracing (magenta) was performed at all three developmental stages. (b–b‴) At E11.5, Cntn2 immunoreactivity is in Prokr2 traced pioneer/TN neurons (arrowheads) emerging from the olfactory epithelium (OE) proximal to the forebrain (FB). (c–c‴‴) Cntn2 immunoreactivity is detected in the traced Prokr2 cells at E12.5, migrating from the VNO to the forebrain junction (FBJ). (d–d‴‴) Visualizing at E13.5, an increased number of Prokr2 traced neurons positive for Cntn2 are present in the VNO and FBJ. Scale bars in (c‴′–c‴‴, d‴′‐d‴‴) 25 μm; (b′–b‴, c′–c‴, d′–d‴) 50 μm; b–d 100 μm.
FIGURE 6
FIGURE 6
Using Cntn2CreERT2 to label cell bodies and Cntn2 to highlight the axons of pioneer neurons/terminal nerve (TN). (a–d) Developmental time‐course of Cntn2 immunoreactivity in the developing vomeronasal organ (VNO) and migratory TN from E12.5 (1 DPI), E13.5 (2 DPI), and E15.5 (4 DPI) using Cntn2CreERT2 +/−/Ai14+/− mice. Immunostaining for Cntn2 (green) and Cntn2 lineage tracing (magenta) was performed at all three developmental stages. Arrowheads indicate neurons that are traced for Cntn2, and empty arrowheads indicate neurons that are both traced for Cntn2 and express Cntn2. (a–a‴) E12.5 reveals Cntn2 traced pioneer/TN neurons labelling cell bodies and Cntn2 immunoreactivity within the axons and fibers. (b–b‴) At E13.5, Cntn2 immunoreactivity was found to be greater in Cntn2‐traced neurons migrating out of the VNO, toward the forebrain junction (FBJ) proximal to the olfactory bulb (OB). (c–c‴) At E15.5, Cntn2 immunoreactivity was not detected in the Cntn2‐traced neurons near the VNO. Red blood cells are marked with asterisks. (d) Quantifications of Cntn2 tracing and traced neurons that are positive for Cntn2 expression from E12.5‐E15.5, show an increase in Cntn2 expression at E13.5. Mean for 1DPI: Cntn2 tracing, 83% (SD ± 8%; n = 3); Cntn2 tracing+Cntn2 expression, 17% (SD ± 8%; n = 3); mean for 2DPI: Cntn2 tracing, 62% (SD ± 1%; n = 3); Cntn2 tracing + Cntn2 expression, 38% (S.D. ± 1%; n = 3); mean for 3DPI: Cntn2 tracing, 80% (SD ± 4%; n = 3); Cntn2 tracing+Cntn2 expression, 21% (SD ± 4%; n = 3). Individual percentage values are represented as dots. (e) Quantification of Cntn2 traced neurons in the nasal area from E12.5‐E15.5 shows significant changes over time (±SD, one‐way ANOVA, p < 0.05, F = 40.07, n = 3, top asterisk), multiple comparisons significance was determined via Dunnett's Test (***p = 0.0003). The data used for the one‐way ANOVA had normal distribution, equal variance and was adjusted for multiple comparisons (Mean for 1DPI, 18% (S.D. ± 6%; n = 3); 2 DPI, 49% (S.D. ± 1%; n = 3); 3 DPI 34% (S.D. ± 4%; n = 3). Individual average values are represented as dots. Scale bars in a′–a‴, b′–b‴, c′–c‴, 25 μm; (a, b, c) 100 μm.
FIGURE 7
FIGURE 7
The GnRH‐1 neurons are positive for Contactin‐2 (Cntn2) tracing. (a–e‴) Double immunostaining of GnRH‐1 (green, arrows) with Cntn2 tracing (magenta, arrowheads) and GnRH‐1 neurons that are traced for Cntn2 (white, empty arrowheads) in a time course from E12.5 (1 day post‐injection (DPI)), 2 DPI E13.5 and 4 DPI E15.5. (b) Cntn2CreERT2 +/−/Ai14+/− mice were injected with tamoxifen at E11.5 and collected at E12.5‐E15.5. The relationship between GnRH‐1 neurons (green) and GnRH‐1 neurons that are traced (white) is depicted by the pie charts next to the images. (a–a‴) E12.5 shows Cntn2 traced neurons, GnRH‐1 neurons, and Cntn2 traced neurons positive for GnRH‐1 expression within and outside of the vomeronasal organ (VNO); (c–c‴) At E13.5 there is an increase of the three populations migrating out of the VNO; Cntn2 traced neurons can be seen in the olfactory epithelium (OE) and olfactory bulb (OB). Red blood cells are marked with asterisks. (d–d‴) E15.5 shows all three populations of neurons invading the brain at the forebrain junction (FBJ), while very few are still migrating out from the VNO. Red blood cells are marked with asterisks. (e–e‴) A magnification of the basal forebrain (bFB) at E15.5, with the three populations of neurons invading. Scale bars in (c′–c‴ 25 μm; a′–a‴, d′–d‴ 50 μm; (a, c, d, e) 100 μm.
FIGURE 8
FIGURE 8
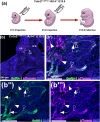
Double injections at E11.5 and E12.5 trace GnRH‐1 neurons invading the brain. (a) Cntn2CreERT2 +/−/Ai14+/− mice were injected with tamoxifen at E11.5 and E12.5 and collected at E15.5. (b–b‴) Double immunostaining of GnRH‐1 (green, arrows) and Cntn2 tracing (magenta, arrowheads) at E15.5. Many GnRH‐1 neurons are observed to be invading the basal forebrain (bFB) with Cntn2 traced neurons and GnRH‐1 neurons that are traced for Cntn2 (white, empty arrowheads). The olfactory bulb (OB) was positive for Cntn2 tracing. Scale bars in (b, 200 μm; (b′–b‴) 100 μm.
FIGURE 9
FIGURE 9
Isl1 immunoreactivity precedes Cntn2 expression. (a–c) Double immunofluorescent staining of Isl1 (green, arrows) and Cntn2 tracing (magenta, arrowheads). (b) Cntn2CreERT2 +/−/Ai14+/− mice were injected with tamoxifen at E11.5 and collected at E12.5 and E13.5. Isl1 expression is depicted by the pie charts next to the images, Isl1+ neurons (green) and Isl1 neurons that are traced (white). (a–a‴, c–c‴) At E12.5 and E13.5, migratory neurons expressing Isl1, Cntn2 tracing, and Isl1 immunopositive traced neurons (white, empty arrowheads) were observed to be approaching the brain, proximal to the olfactory bulb (OB). Asterisks indicate red blood cells. Scale bars in (a′–a‴) 25 μm; (c′‐c‴) 50 μm; (a, c) 100 μm.

Update of

Similar articles

References

    1. Amato, E., Jr. , Taroc E. Z. M., and Forni P. E.. 2024. “Illuminating the Terminal Nerve: Uncovering the Link Between GnRH‐1 Neuron and Olfactory Development.” Journal of Comparative Neurology 532: e25599. - PMC - PubMed
    1. Barraud, P. , Seferiadis A. A., Tyson L. D., et al. 2010. “Neural Crest Origin of Olfactory Ensheathing Glia.” Proceedings of the National Academy of Sciences of the United States of America 107: 21040–21045. - PMC - PubMed
    1. Barraud, P. , St John J. A., Stolt C. C., Wegner M., and Baker C. V.. 2013. “Olfactory Ensheathing Glia Are Required for Embryonic Olfactory Axon Targeting and the Migration of Gonadotropin‐Releasing Hormone Neurons.” Biology Open 2: 750–759. - PMC - PubMed
    1. Casoni, F. , Malone S. A., Belle M., et al. 2016. “Development of the Neurons Controlling Fertility in Humans: New Insights From 3D Imaging and Transparent Fetal Brains.” Development 143: 3969–3981. - PubMed
    1. Chao, D. L. , Ma L., and Shen K.. 2009. “Transient Cell‐Cell Interactions in Neural Circuit Formation.” Nature Reviews. Neuroscience 10: 262–271. - PMC - PubMed

LinkOut - more resources