Inflammatory markers and blood glucose are higher after morning vs afternoon exercise in type 2 diabetes
- PMID: 40580209
- PMCID: PMC12361293
- DOI: 10.1007/s00125-025-06477-5
Inflammatory markers and blood glucose are higher after morning vs afternoon exercise in type 2 diabetes
Abstract
Aims/hypothesis: The aim of this study was to investigate effects of time of day on glucose management in individuals with type 2 diabetes undertaking high-intensity interval exercise. Additionally, the association between regular eating behaviour and mean amplitude of glycaemic excursions was examined. Specifically, the primary outcome was to determine the effect of the intervention on 24 h glucose levels.
Methods: A crossover trial was conducted, comprising 12 men and 12 women with type 2 diabetes and 12 men and 12 women without diabetes. Participants performed high-intensity interval exercise sessions in the morning (09:00 hours) or afternoon (16:00 hours) on separate days at least 7 days apart. Standardised meals were provided the day before exercise, on the day of exercise and on the day after exercise. Continuous glucose monitoring was used to estimate blood glucose levels.
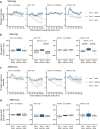
Results: The 24 h glucose profile did not differ between morning and afternoon exercise across cohorts. However, morning exercise increased blood glucose during the 2 h post-exercise period in men (p<0.05) and women (p<0.01) with type 2 diabetes, but blood glucose was unaltered following afternoon exercise. Glycaemic variability (assessed using the mean amplitude of glycaemic excursions) was reduced during the 3 day meal intervention in men (p<0.001) and women (p<0.05) with type 2 diabetes, but not in individuals without diabetes. Participants exhibited higher morning cortisol levels (p<0.001) compared with afternoon cortisol levels, independently of diagnosis. Individuals with type 2 diabetes exhibited higher levels of the inflammation marker C-reactive protein (p<0.001) and the heart failure marker NT-proBNP (p<0.001) in the morning than in the afternoon.
Conclusions/interpretation: In type 2 diabetes, afternoon high-intensity interval exercise appears to be more effective than morning high-intensity interval exercise for maintaining glucose management. Further research is needed to explore how elevated morning cortisol levels and inflammatory markers influence the exercise response and affect glucose regulation. Additionally, consistent meal timing and controlled energy intake are recommended for reducing the mean amplitude of glycaemic excursions.
Trial registration: ClinicalTrials.gov NCT05115682.
Keywords: Circadian biology; Continuous glucose monitoring; Diet; High-intensity interval exercise; Inflammation; Sex differences; Type 2 diabetes.
© 2025. The Author(s).
Conflict of interest statement
Acknowledgements: We thank M. Domeij and H. Karlsson from Karolinska Institutet for contributing to this research, as well as the Biobank and Study Support facility at Karolinska University Hospital. Data availability: All source data are available from the corresponding author on request. Funding: This study was supported by grants from the EFSD/Lilly European Diabetes Research Program and EFSD/Novo Nordisk A/S Program for Diabetes Research in Europe, the Novo Nordisk Foundation (NNF14OC0011493 and NNF22OC0077741), Region Stockholm (ALF project 954154 and 962291), the European Research Council (ERC-2023-AdG 1011420930), the Swedish Research Council (2015-00165, 2022-00609), the Swedish Diabetes Foundation (DIA2021-641, DIA2023-824), Diabetes Wellness Sverige (PG21-6524), the Swedish Heart and Lung Foundation (20200627 and 20210536), a Wallenberg Scholar grant from the Knut and Alice Wallenberg Foundation (2023.0312) and a European Foundation for the Study of Diabetes/Novo Nordisk Foundation Future Leaders Award (NNF21SA0072747). This study was supported by the Novo Nordisk Foundation Center for Basic Metabolic Research, an independent research centre at the Faculty of Health and Medical Sciences, University of Copenhagen, Denmark, which is partially funded by an unrestricted donation from the Novo Nordisk Foundation (NNF18CC0034900, NNF23SA0084103). Authors’ relationships and activities: The authors declare that there are no relationships or activities that might bias, or be perceived to bias, their work. Contribution statement: MJK, AJB, JABS, MS, KM, MJ, SBÖ, CN, MB, AR, MC, KC, AK, NJP, JRZ and HW-H made substantial contributions to the conception or design of the work; or the acquisition, analysis or interpretation of data. MJK, AJB, AK, NJP, JRZ and HW-H were responsible for drafting the article or reviewing it critically for important intellectual content. All authors gave final approval of the version of the manuscript to be published. HW-H supervised the whole project and is the guarantor of this work.
Figures


Similar articles
-
Effects of exercise and exercise timing on energy intake and appetite control in Danish individuals with overweight or obesity with and without type 2 diabetes: a protocol for a randomised controlled cross-over trial.BMJ Open. 2025 Feb 6;15(2):e092683. doi: 10.1136/bmjopen-2024-092683. BMJ Open. 2025. PMID: 39915022 Free PMC article.
-
Treatment of periodontal disease for glycaemic control in people with diabetes mellitus.Cochrane Database Syst Rev. 2015 Nov 6;2015(11):CD004714. doi: 10.1002/14651858.CD004714.pub3. Cochrane Database Syst Rev. 2015. Update in: Cochrane Database Syst Rev. 2022 Apr 14;4:CD004714. doi: 10.1002/14651858.CD004714.pub4. PMID: 26545069 Free PMC article. Updated.
-
Preexisting Diabetes and Pregnancy: An Endocrine Society and European Society of Endocrinology Joint Clinical Practice Guideline.Eur J Endocrinol. 2025 Jun 30;193(1):G1-G48. doi: 10.1093/ejendo/lvaf116. Eur J Endocrinol. 2025. PMID: 40652450
-
Different intensities of glycaemic control for women with gestational diabetes mellitus.Cochrane Database Syst Rev. 2023 Oct 10;10(10):CD011624. doi: 10.1002/14651858.CD011624.pub3. Cochrane Database Syst Rev. 2023. PMID: 37815094 Free PMC article.
-
Techniques of monitoring blood glucose during pregnancy for women with pre-existing diabetes.Cochrane Database Syst Rev. 2017 Jun 11;6(6):CD009613. doi: 10.1002/14651858.CD009613.pub3. Cochrane Database Syst Rev. 2017. Update in: Cochrane Database Syst Rev. 2019 May 23;5:CD009613. doi: 10.1002/14651858.CD009613.pub4. PMID: 28602020 Free PMC article. Updated.
References
Associated data
Grants and funding
- 2015-00165/Vetenskapsrådet
- 2022-00609/Vetenskapsrådet
- DIA2021-641/Diabetesförbundet
- DIA2023-824/Diabetesförbundet
- NNF14OC0011493/Novo Nordisk Fonden
- NNF18CC0034900/Novo Nordisk Fonden
- NNF21SA0072747/Novo Nordisk Fonden
- NNF22OC0077741/Novo Nordisk Fonden
- NNF23SA0084103/Novo Nordisk Fonden
- 20200627/Hjärt-Lungfonden
- 20210536/Hjärt-Lungfonden
- 2023.0312/Knut och Alice Wallenbergs Stiftelse
- ERC-2023-AdG 1011420930/H2020 European Research Council
- PG21-6524/Insamlingsstiftelsen Diabetes Wellness Network Sverige
LinkOut - more resources
Full Text Sources
Medical
Research Materials

