. 2025 Jun 28;82(1):262.
doi: 10.1007/s00018-025-05755-0.

NR4A2 attenuates early brain injury after intracerebral hemorrhage by promoting M2 microglial polarization via TLR4/TRAF6/NF-κB pathway inhibition

Affiliations

NR4A2 attenuates early brain injury after intracerebral hemorrhage by promoting M2 microglial polarization via TLR4/TRAF6/NF-κB pathway inhibition

Di Hu et al. Cell Mol Life Sci. .

Abstract

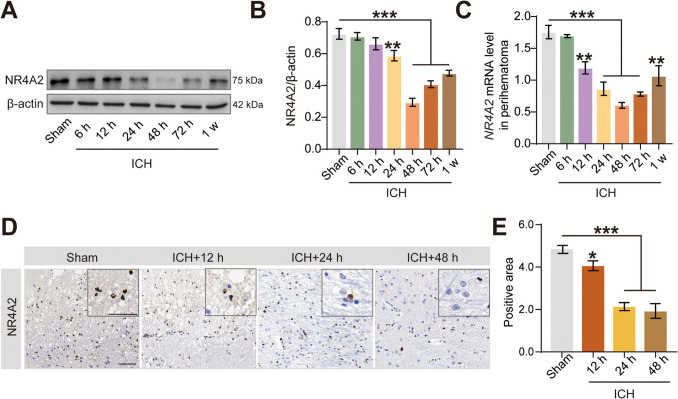
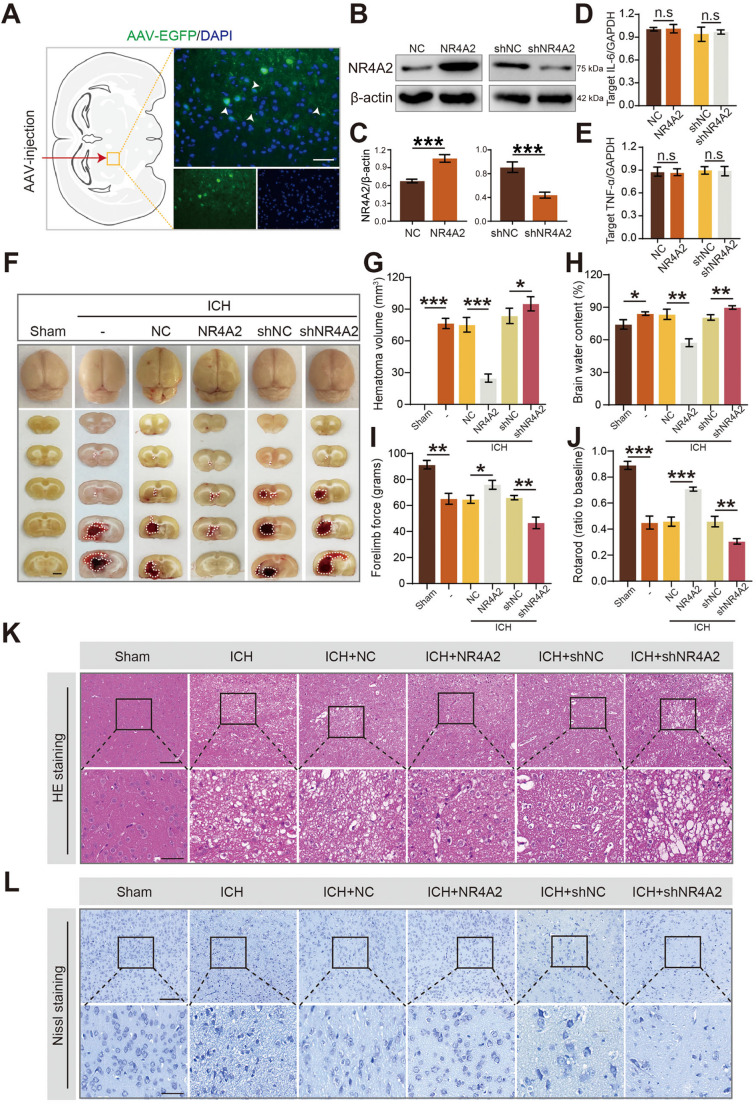
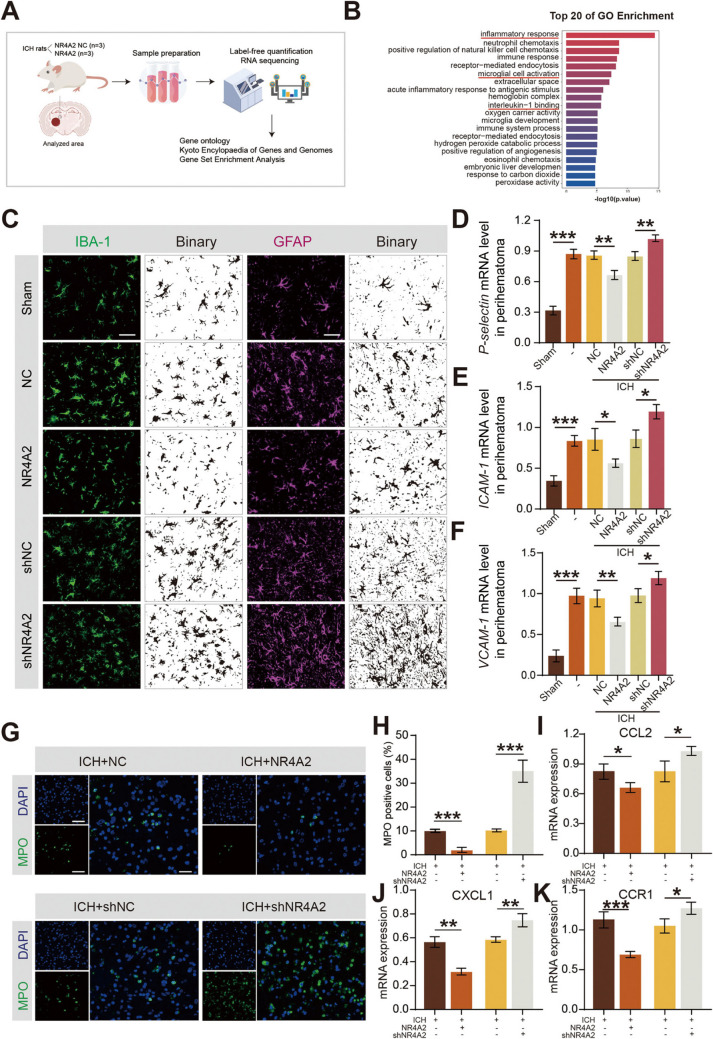
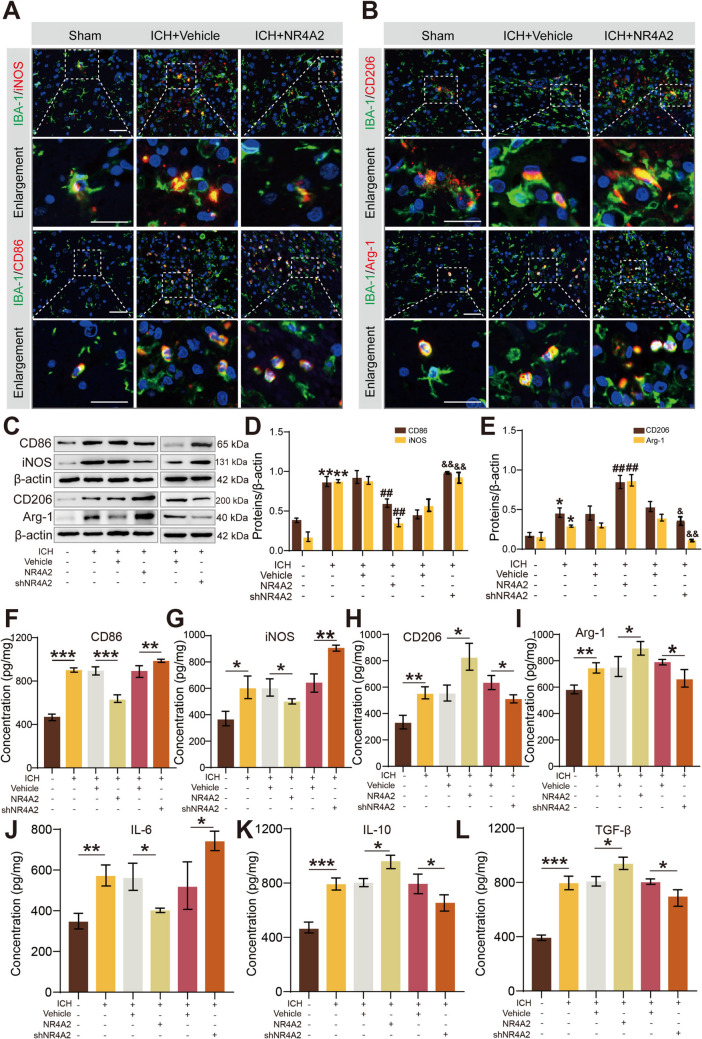
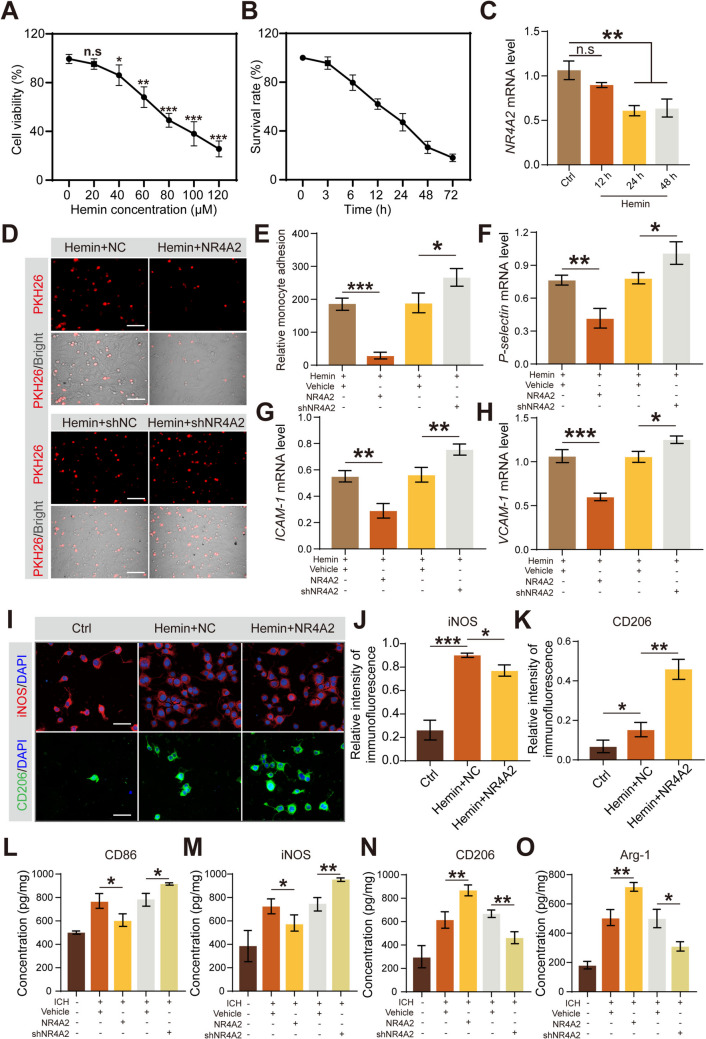
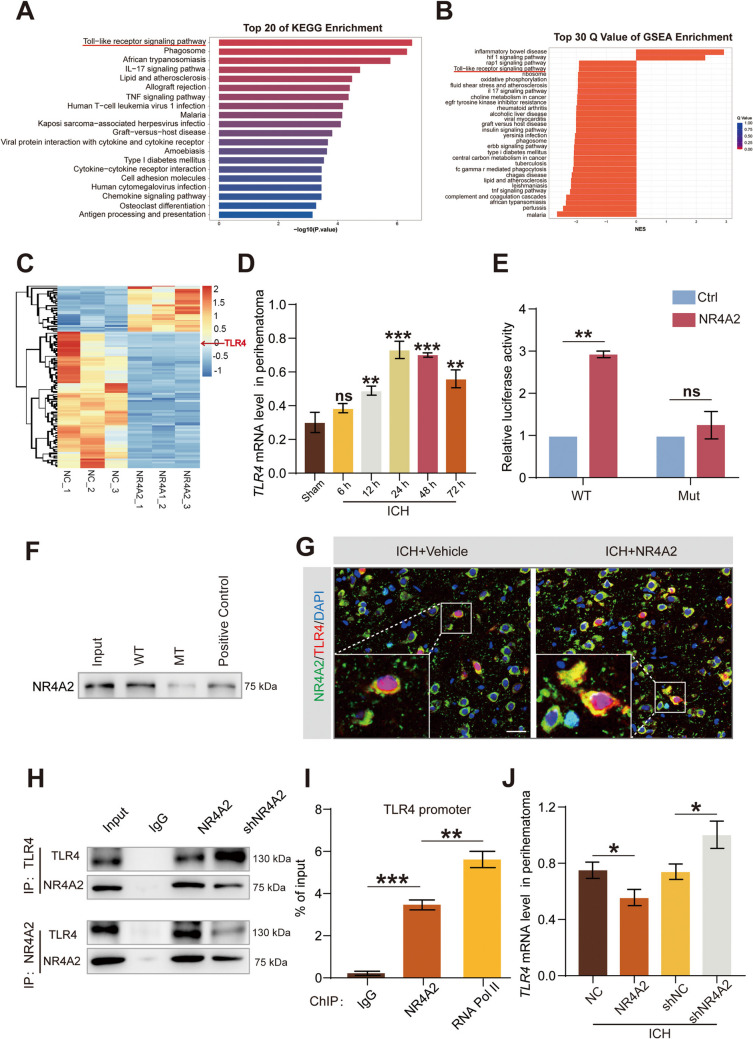
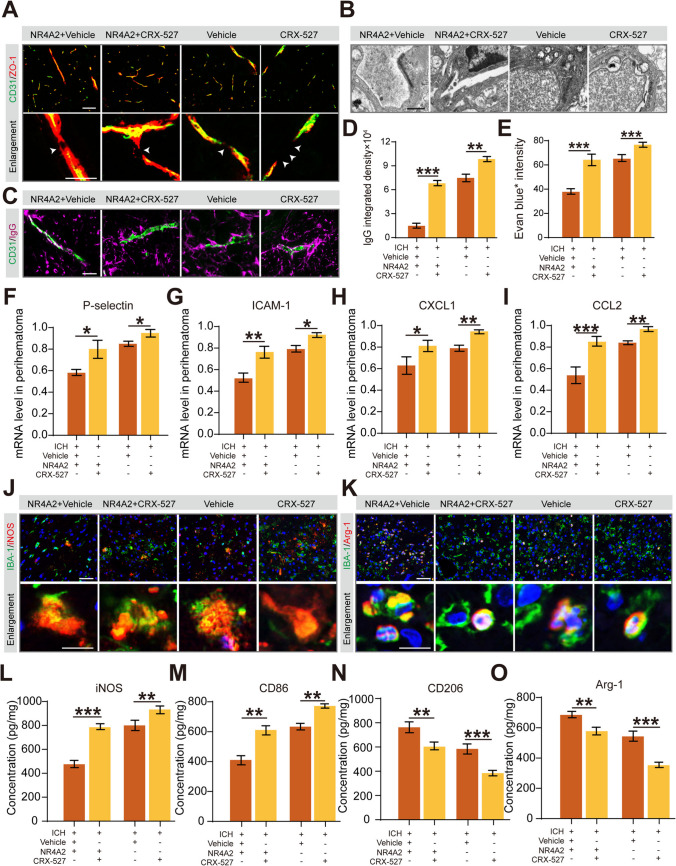
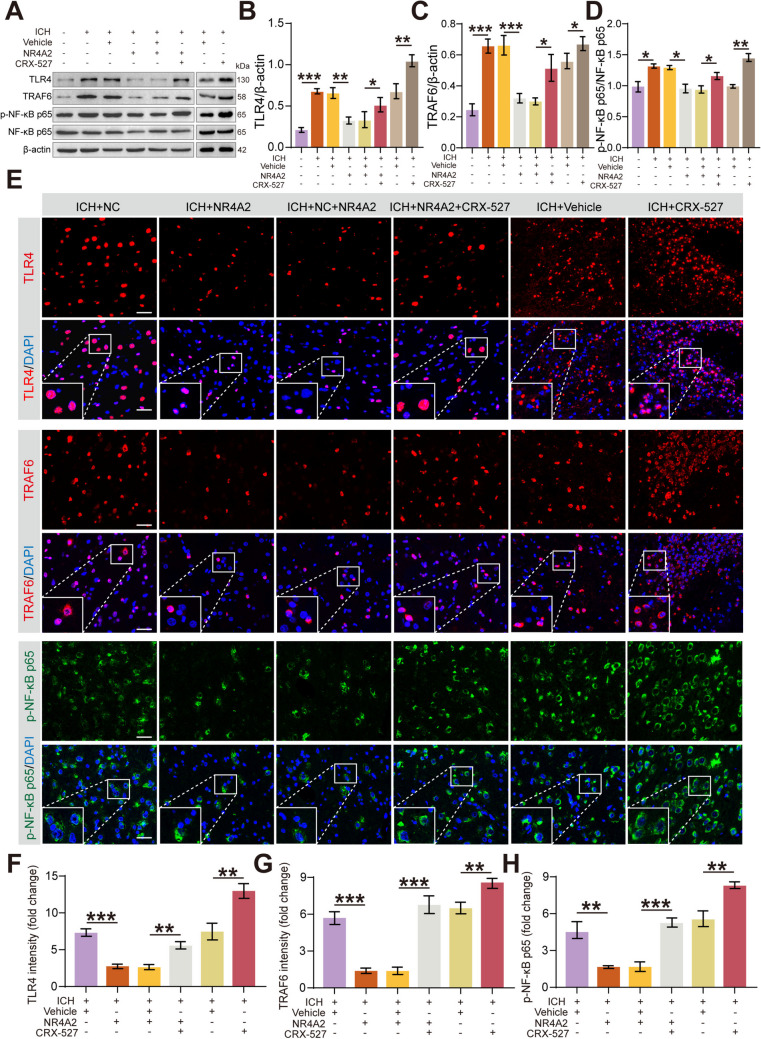
In the early stage of intracerebral hemorrhage (ICH), rebleeding occurs when blood from the initial hematoma permeates the surrounding brain parenchyma through the disrupted blood-brain barrier (BBB), exacerbating brain injury. Neuroinflammation is a critical driver of the pathological processes underlying this phenomenon. Research on microglia near early hematomas revealed that promoting the transition of microglia to the M2 phenotype could mitigate perihematomal inflammatory damage. Recent studies have shown that the nuclear receptor-related 1 protein (NR4A2) can regulate microglial function and inhibit inflammation. However, the functions of NR4A2 in the development of ICH are still unclear. In this study, we explored the potential protective effect and mechanism of NR4A2 in ICH models. Our results demonstrated that the expression of NR4A2 was significantly decreased in both ICH rats and cell models. Increasing NR4A2 activity could effectively decrease the hematoma volume, improve the neurological prognosis and alleviate perihematomal BBB damage. In vivo and in vitro experiments revealed that NR4A2 inhibited perihematomal inflammatory damage by driving microglial polarization toward the anti-inflammatory M2 phenotype. Mechanistically, NR4A2 targeted TLR4 and inhibited the TRAF6/NF-κB pathway, thereby promoting M2 microglial polarization, reducing inflammatory cell extravasation and maintaining the integrity of the BBB. Conversely, the protective effects of NR4A2 were negated when CRX-527 (a TLR4 agonist) was introduced. These findings suggest that NR4A2 represents a promising therapeutic target for ICH.

Keywords: Blood–brain barrier; Microglial polarization; NR4A2; Neuroinflammation; TLR4; TRAF6/NF-κB.


Conflict of interest statement

Declarations. Ethical approval: The animal protocols were reviewed and approved by the Institutional Animal Care and Use Committee of the First Affiliated Hospital of Guangzhou Medical University, Guangzhou, China. Competing interests: The authors declare that they have no competing interests.

Figures

Fig. 1
Fig. 1
Expression of NR4A2 post-ICH. (A) Western blot analysis of NR4A2 levels. n = 6. (B) Statistical analysis of the western blot in (A). (C) RT-qPCR analysis of NR4A2 mRNA levels. n = 6. (D, E) Representative images of NR4A2 immunostaining. n = 6. Scale bar, 50 μm. The data represent the means ± SD. *P < 0.05; **P < 0.01; ***P < 0.001
Fig. 2
Fig. 2
The impact of NR4A2 on hemorrhagic damage and behavioral outcomes following ICH. (A) Schematic diagram of AAV injection in the brain tissues of rats. Scale bar, 50 μm. (B) The presence of NR4A2 in the perihematomal brain areas of ICH rats after injection with NR4A2-overexpressing AAV or NR4A2-knockdown AAV. (C) Statistical analysis of (B). (D, E) RT-qPCR analysis of the IL-6 (D) and TNF-α (E) mRNA levels. n = 6. (F) Whole-brain sections. n = 5. Scale bar, 5 mm. (G) Statistical analysis of the ICH volume in each group. (H) Quantification of the brain water content (%) in each group. n = 6. (I, J) Neurological functions were detected by the forelimb force test and rotarod test. n = 15. (K) HE staining. (L) Nissl staining. The data represent the means ± SD. *P < 0.05; **P < 0.01; ***P < 0.001. ns: not significant, P > 0.05
Fig. 3
Fig. 3
NR4A2 attenuates BBB breakdown after ICH. (A) The penetration of FITC-dextran. n = 6. Scale bar, 2 mm. (B) Quantification of the permeability (A) of the product of FITC-dextran. (C) The presence of infiltrated IgG in each group. n = 6. Scale bar, 10 μm. (D) Quantitation of IgG (C) perivascular accumulation. (E–G) Intercellular junctions were visualized in each group. n = 6. Scale bar, 50 μm. (H) Quantification of EB extravasation. n = 5. (I) Ultrastructure of the BBB in each group was analyzed via TEM. n = 6. Scale bar, 250 nm. The data represent the means ± SD. *P < 0.05; **P < 0.01; ***P < 0.001
Fig. 4
Fig. 4
NR4A2 exerts an anti-inflammatory effect after ICH. (A, B) Schematic diagram of RNA sequencing (A) and the top 20 enriched GO terms (B). (C) Microglial morphology (IBA-1) and astrocyte morphology (GFAP) were detected via immunofluorescence in each group. n = 6. Scale bar, 50 μm. (D-F) Relative gene expression of P-selectin (D), ICAM-1 (E) and VCAM-1 (F) in each group. n = 6. (G, H) Immunofluorescence and quantification of MPO activity. n = 5. (I-K) Relative gene expression of CCL2 (I), CXCL1 (J) and CCR1 (K) in each group. n = 5. The data represent the means ± SD. *P < 0.05; **P < 0.01; ***P < 0.001
Fig. 5
Fig. 5
Effect of NR4A2 on microglial polarization after ICH. (A, B) Representative images of double immunostaining showing BV2 microglial polarization. Scale bar, 50 μm. (C) The protein levels of M1 phenotype markers (iNOS and CD86) and M2 phenotype markers (CD206 and Arg-1) in each group. n = 6. (D, E) Densitometric quantification of (C). (F-I) ELISA analyses of the expression of CD86 (F), iNOS (G), CD206 (H) and Arg-1 (I). n = 6. (J-L) Expression of the proinflammatory cytokine IL-6 (J) and the anti-inflammatory cytokines (IL-10 and TGF-β) (K, L). n = 6. The data represent the means ± SD. *P < 0.05; **P < 0.01; ***P < 0.001
Fig. 6
Fig. 6
The effects of NR4A2 on BBB inflammation and microglial polarization in vitro in the ICH environment. (A) Effects of different concentrations of hemin on cell proliferation. (B) Effects of different durations of hemin treatment on cell survival. (C) RT-qPCR assay for NR4A2 mRNA levels. (D, E) Representative images (D) and quantification of the attachment of THP-1 cells labeled with PKH26 (E). (FH) Relative gene expression of P-selectin (F), ICAM-1 (G) and VCAM-1 (H). (I-K) Representative images of double immunostaining of BV2 microglial polarization. Scale bar, 50 μm. (L-O) ELISA analyses of the expression of CD86 (L), iNOS (M), CD206 (N) and Arg-1 (O). The data represent the means ± SD. *P < 0.05; **P < 0.01; ***P < 0.001
Fig. 7
Fig. 7
Screening and identification of the target gene of NR4A2. (A) The top 20 enriched KEGG terms identified via RNA sequencing. (B) The top 30 Q values of GSEA enrichment. (C) Heatmap showing differentially expressed genes (from RNA-seq) between control and NR4A2-overexpressing perihematomal brain tissues. (D) RT-qPCR analysis of TLR4 mRNA levels. n = 6. (E) Dual luciferase assay. (F) Pulled down assay. (G) Representative images revealing the colocalization of NR4A2 and TLR4 in the perihematomal brains of ICH-operated rats subjected to vehicle treatment or NR4A2 overexpression. Scale bar, 50 μm. n = 6. (H) Co-immunoprecipitation assay. (I) ChIP-qPCR assay. (J) RT-qPCR analysis of TLR4 mRNA levels after NR4A2 overexpression or knockdown. The data represent the means ± SD. *P < 0.05; **P < 0.01; ***P < 0.001
Fig. 8
Fig. 8
The TLR4 agonist CRX-527 abolishes NR4A2-dependent BBB protection and the anti-inflammatory M2 phenotype. (A) Intercellular junctions were visualized in each group. n = 6. Scale bar, 50 μm. (B) The ultrastructure of the BBB in each group was imaged via TEM analysis. n = 6. Scale bar, 250 nm. (C, D) The presence of infiltrated IgG. n = 6. Scale bar, 10 μm. (E) Quantification of EB extravasation. n = 6. (F, G) Relative gene expression of P-selectin (F) and ICAM-1 (G). (H, I) Relative gene expression of CXCL1 (H) and CCL2 (I). (J-O) Representative images of BV2 microglial polarization. n = 6. Scale bar, 50 μm. The data represent the means ± SD. *P < 0.05; **P < 0.01; ***P < 0.001
Fig. 9
Fig. 9
NR4A2 suppresses TLR4-mediated TRAF6/NF-κB inflammatory signals. (A) Representative immunoblots and quantification of TLR4, TRAF6, p-NF-κB p65 and NF-κB p65 in each group. n = 6. (B-D) Densitometric quantification of (A). (E) Representative immunofluorescence images showing TLR4 (red), TRAF6 (red) and p-NF-κB p65 (green). (FH) Quantitative analysis of (E). n = 6. Scale bar, 50 μm. The data represent the means ± SD. *P < 0.05; **P < 0.01; ***P < 0.001

Similar articles

References

    1. Lee TH (2025) Intracerebral hemorrhage [J]. Cerebrovasc Dis Extra 15(1):1–8 - PMC - PubMed
    1. Magid-Bernstein J, Girard R, Polster S, Srinath A, Romanos S, Awad IA et al (2022) Cerebral hemorrhage: pathophysiology, treatment, and future directions [J]. Circ Res 130(8):1204–1229 - PMC - PubMed
    1. Rost NS, Brodtmann A, Pase MP, van Veluw SJ, Biffi A, Duering M et al (2022) Post-stroke cognitive impairment and dementia [J]. Circ Res 130(8):1252–1271 - PubMed
    1. Zille M, Farr TD, Keep RF, Römer C, Xi G, Boltze J (2022) Novel targets, treatments, and advanced models for intracerebral haemorrhage [J]. EBioMedicine 76:103880 - PMC - PubMed
    1. Rehni AK, Cho S, Quero HN, Shukla V, Zhang Z, Dong C et al (2022) Red blood cell microparticles limit hematoma growth in intracerebral hemorrhage [J]. Stroke 53(10):3182–3191 - PMC - PubMed

MeSH terms

Substances

LinkOut - more resources