Quadruple-refocused spin-locking: A robust method for high-amplitude T1ρ imaging
- PMID: 40580517
- PMCID: PMC12322236
- DOI: 10.1002/mrm.30621
Quadruple-refocused spin-locking: A robust method for high-amplitude T1ρ imaging
Abstract
Purpose: Longitudinal relaxation time in the rotating frame (T1ρ) is a source of tissue-specific contrasts, with applications in detecting myocardial fibrosis, liver fibrosis, and early-stage osteoarthritis. However, T1ρ measurements are sensitive to static (B0) and radiofrequency (B1) magnetic field inhomogeneities. Improving the accuracy of T1ρ quantification can enable earlier and more reliable detection of pathological changes, providing a basis for early intervention. Therefore, we have developed an improved, quadruple-refocused spin-locking (QR-SL) technique based on existing preparation schemes to obtain a more robust compensation for B0 and B1 field inhomogeneities.
Methods: The QR-SL module consists of four 180° refocusing pulses with opposite phases and five spin-locking (SL) pulses with phase cycling according to the rotary-echo principle. The performance of the proposed QR-SL module is evaluated through numerical simulations and experimental validation in comparison to composite-SL (C-SL), balanced-SL (B-SL), and triple-refocused-SL (TR-SL) preparation modules.
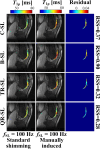
Results: Numerical simulations indicate that the QR-SL module demonstrates improved tolerance to a range of B0 and B1 field inhomogeneities compared to the other three modules. In scenarios involving inhomogeneities of both fields, the experimental results show that the residual sum of squares of the QR-SL module was decreased by 24.3%, 68.9%, and 12.5% for in vivo knee cartilage, respectively, compared to the composite SL, balanced SL, and triple-refocused SL preparation modules.
Conclusion: The QR-SL module has the potential to produce more accurate T1ρ maps, while minimizing artifacts. Consequently, the QR-SL module is more favorable for T1ρ quantification, especially for low-field and ultralow-field quantitative MRI.
Keywords: T1ρ relaxation; artifacts compensation; field inhomogeneity; quantitative MRI; spin locking.
© 2025 The Author(s). Magnetic Resonance in Medicine published by Wiley Periodicals LLC on behalf of International Society for Magnetic Resonance in Medicine.
Conflict of interest statement
Nothing to report.
Figures


Similar articles
-
Initial experience of cardiac T1ρ mapping at 0.55 T: Continuous wave versus adiabatic spin-lock preparation pulses.Magn Reson Med. 2025 Oct;94(4):1644-1653. doi: 10.1002/mrm.30582. Epub 2025 May 20. Magn Reson Med. 2025. PMID: 40391626 Free PMC article.
-
Novel spin-lock time sampling strategies for improved reproducibility in quantitative T1ρ mapping.NMR Biomed. 2024 Dec;37(12):e5244. doi: 10.1002/nbm.5244. Epub 2024 Aug 17. NMR Biomed. 2024. PMID: 39152756 Free PMC article.
-
Balanced spin-lock preparation for B1 -insensitive and B0 -insensitive quantification of the rotating frame relaxation time T1ρ.Magn Reson Med. 2021 May;85(5):2771-2780. doi: 10.1002/mrm.28585. Epub 2020 Nov 9. Magn Reson Med. 2021. PMID: 33166009
-
Motion and magnetic field inhomogeneity correction techniques for chemical exchange saturation transfer (CEST) MRI: A contemporary review.NMR Biomed. 2025 Jan;38(1):e5294. doi: 10.1002/nbm.5294. Epub 2024 Nov 12. NMR Biomed. 2025. PMID: 39532518 Review.
-
The Black Book of Psychotropic Dosing and Monitoring.Psychopharmacol Bull. 2024 Jul 8;54(3):8-59. Psychopharmacol Bull. 2024. PMID: 38993656 Free PMC article. Review.
References
-
- Redfield AG. Nuclear magnetic resonance saturation and rotary saturation in solids. Phys Rev. 1955;98:1787‐1809.
-
- Sepponen RE, Pohjonen JA, Sipponen JT, Tanttu JI. A method for T1 rho imaging. J Comput Assist Tomogr. 1985;9:1007‐1011. - PubMed
-
- Mäkelä HI, Gröhn OH, Kettunen MI, Kauppinen RA. Proton exchange as a relaxation mechanism for T1 in the rotating frame in native and immobilized protein solutions. Biochem Biophys Res Commun. 2001;289:813‐818. - PubMed
-
- Knispel RR, Thompson RT, Pintar MM. Dispersion of proton spin‐lattice relaxation in tissues. J Magn Reson. 1974;14:44‐51.
MeSH terms
Substances
Grants and funding
LinkOut - more resources
Full Text Sources
Medical

