. 2025 Sep:85:103736.
doi: 10.1016/j.redox.2025.103736. Epub 2025 Jun 24.

Translocation of SIRT6 promotes glycolysis reprogramming to exacerbate diabetic angiopathy

Affiliations

Translocation of SIRT6 promotes glycolysis reprogramming to exacerbate diabetic angiopathy

Kemiao Pang et al. Redox Biol. 2025 Sep.

Abstract

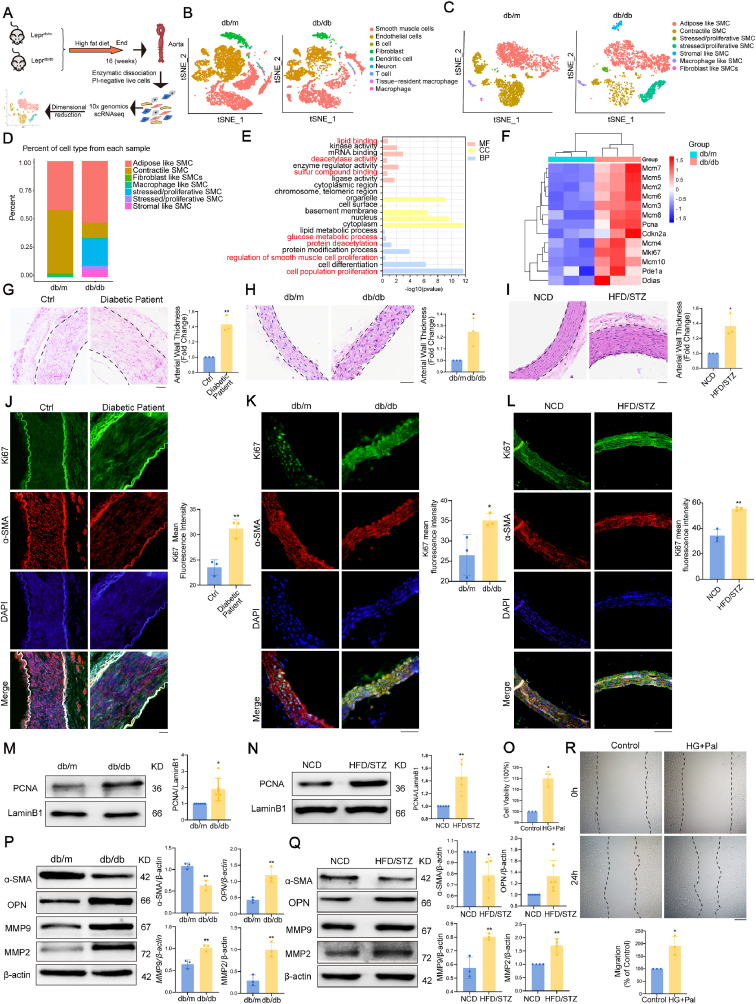
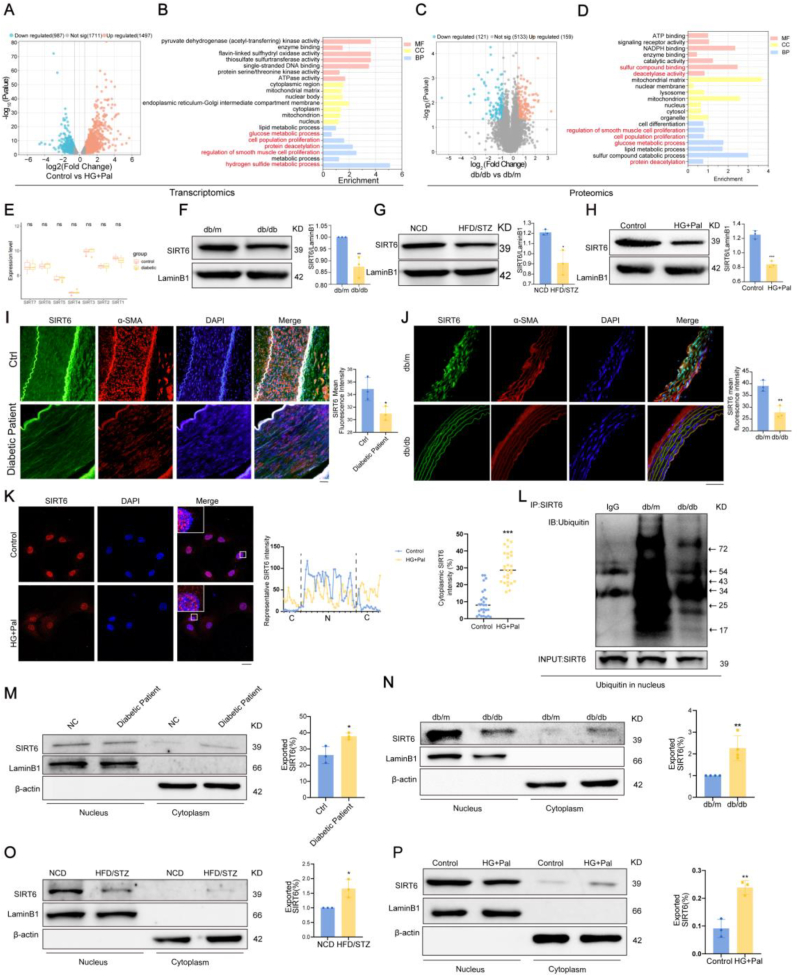
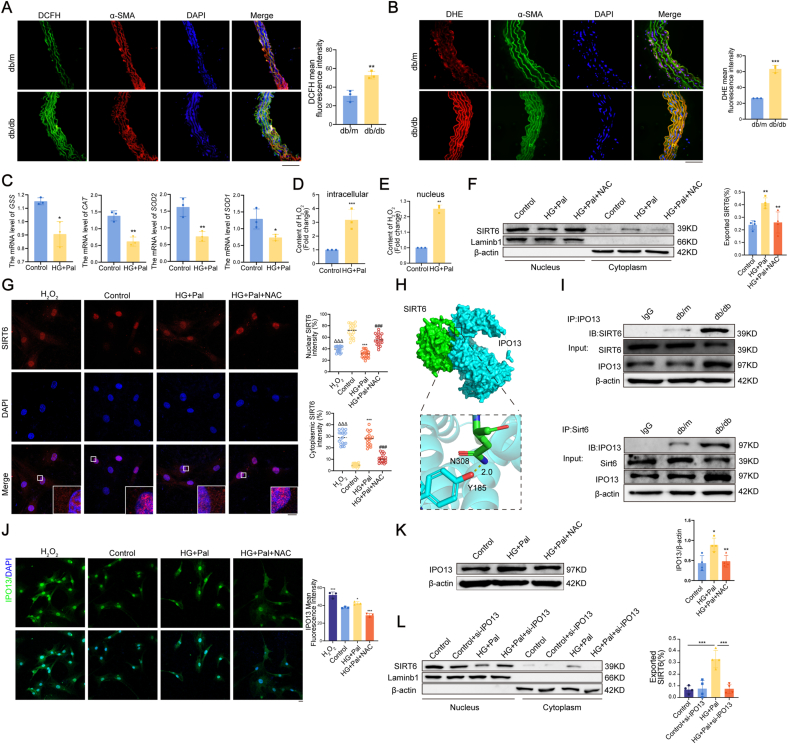
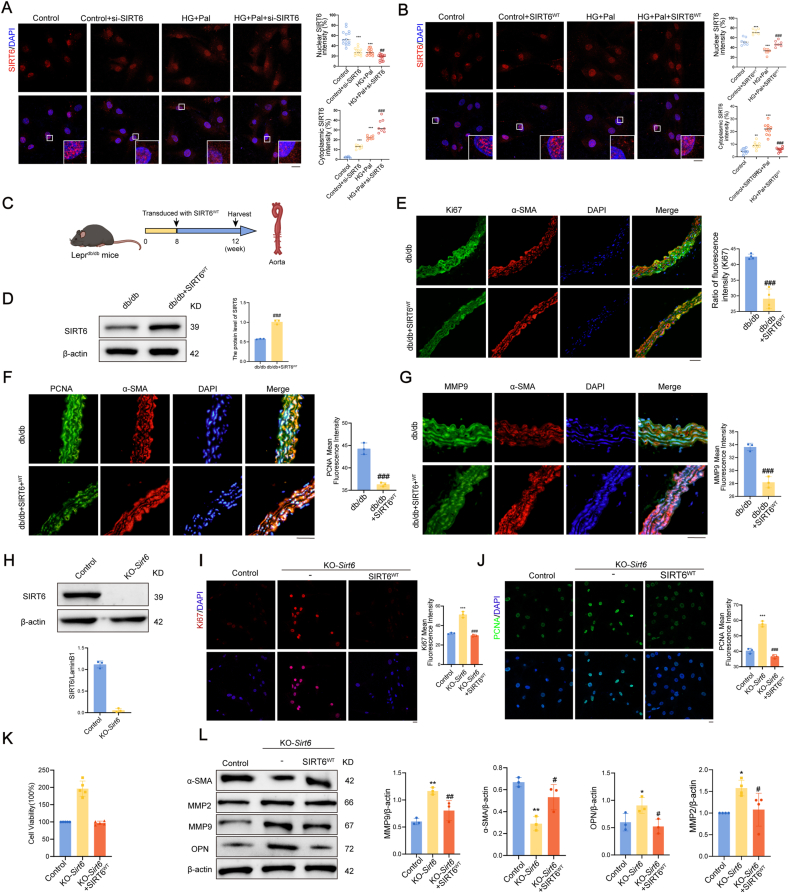
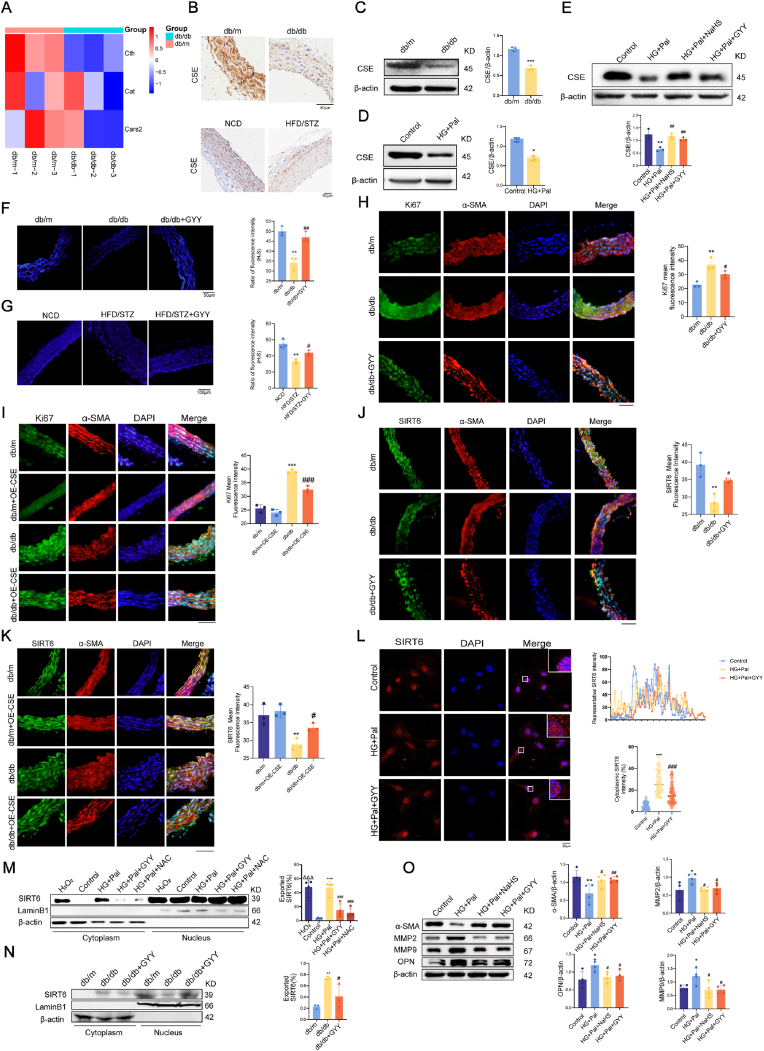
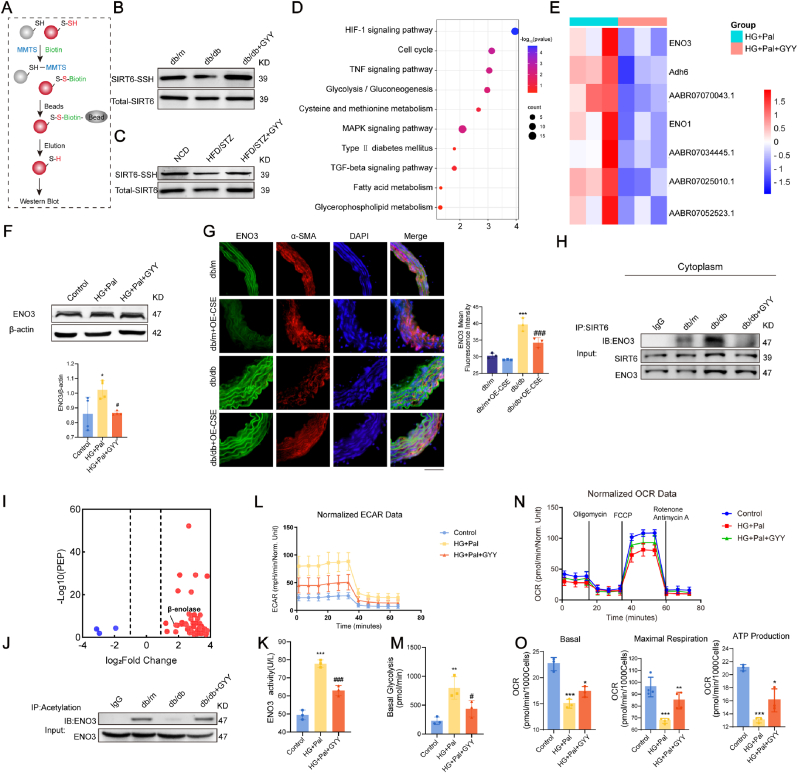
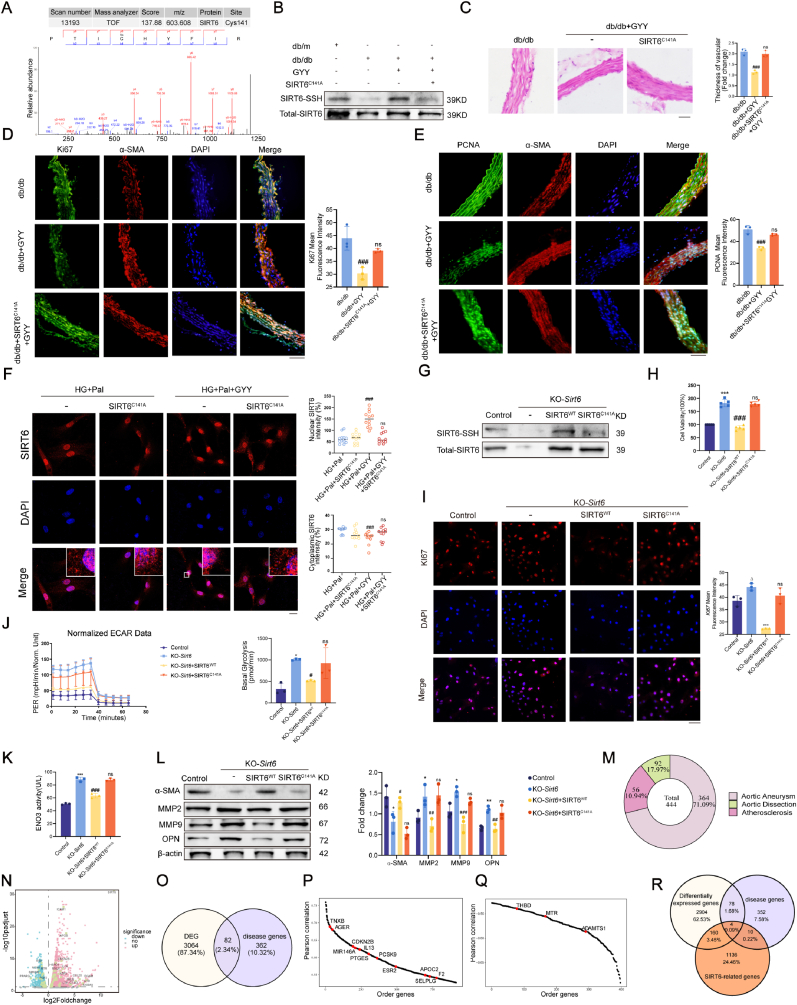
Diabetic angiopathy, a major complication of type 2 diabetes mellitus (T2DM), is driven by vascular dysfunction, metabolic reprogramming, and oxidative stress. NAD+-dependent deacetylase SIRT6, located in the nucleus, is recognized for its role in modulating cardiovascular and metabolic homeostasis through histone deacetylation. However, the functions and mechanisms of accumulation of cytoplasmic SIRT6 in T2DM remain to be elucidated. Herein, a previously unrecognized cytoplasmic role for SIRT6 is identified in promoting pathological glycolysis during diabetic vascular remodeling. Vascular smooth muscle cell (VSMC) proliferation is observed, which is correlated with protein deacetylation, especially SIRT6, which translocated to the cytoplasm mediated by Importin 13 (IPO13). Furthermore, the accumulation of cytoplasmic SIRT6 facilitates its interaction with enolase 3 (ENO3), a newly discovered downstream target. This interaction promotes ENO3 deacetylation, enhances downstream phosphoenolpyruvic acid (PEP) levels, and thereby drives glycolysis reprogramming, ultimately leading to the pathological changes associated with diabetic angiopathy. Notably, exogenous hydrogen sulfide (H2S) restores S-sulfhydration of SIRT6 at cysteine 141, counteracting the SIRT6-ENO3 interaction, suppressing glycolysis, and mitigating VSMC hyperproliferation. This study provides novel insights into the SIRT6-ENO3 pathway through regulating vascular glycolysis reprogramming, highlighting the therapeutic potential of targeting SIRT6 in the management of diabetic angiopathy.

Keywords: Cell proliferation; Glycolysis; Hydrogen sulfide (H(2)S); Sirtuin 6 (SIRT6); Type 2 diabetes (T2D).


Conflict of interest statement

Declaration of competing interest The authors declare no conflict of interest.

Figures

Image 1
Graphical abstract
Fig. 1
Fig. 1
Vascular smooth muscle cells exhibit enhanced proliferation and a contractile-to-synthetic phenotypic switch in type 2 diabetes. (A) Overall experimental procedure. Aortic tissue from three Leprdb/m and three Leprdb/db mice was pooled and enzymatically dissociated to isolate cells, and propidium iodide (PI)-negative cells were subjected to snRNA-seq analysis. (B) tSNE visualization of integrated Leprdb/m and Leprdb/db snRNA-seq analysis. (C) tSNE visualization of proliferative/stress‐type subpopulation in db/m and db/db mice. (D) Cluster-annotated bar charts showing distributions of Leprdb/m and Leprdb/db mice. (E) Genes were annotated into three main categories: Biological Process (BP), Cellular Component (CC), and Molecular Function (MF). (F) Heatmap showing differentially expressed proliferation-related genes in the two groups. (G–I) Representative photographs of H&E-stained sections of the arterial tissue of diabetic patients (scale bars, 100 μm), db/db mice (scale bars, 50 μm), and HFD rats (scale bars, 50 μm). (J–L) Ki67 foci in diabetic patients (scale bars, 100 μm), db/db mice (scale bars, 50 μm), and HFD rats (scale bars, 100 μm). (M, N) Protein levels of PCNA in vascular tissues. (O) Cell viability of rat aortic VSMC measured by CCK-8. (P, Q) The expression of VSMC phenotype switch-related protein. (R) Representative images and quantitative analysis of the wound-healing assay in VSMCs. n = 3∼6. All quantitative data are demonstrated as mean ± SD from independent experiments. ∗P < 0.05, ∗∗P < 0.01, ∗∗∗P < 0.001 versus Ctrl, db/m,NCD or Control by unpaired t-test.
Fig. 2
Fig. 2
Molecular profiling reveals aberrant protein deacetylation and SIRT6 redistribution in diabetic VSMCs. (A) Differentially expressed genes (DEGs) of transcriptomics between the HG + Pal and control groups are highlighted in the volcano plot. (B) Genes were annotated in three main categories: Biological process (BP), cellular component (CC), and molecular function (MF). (C) Differentially expressed genes (DEGs) of proteomics between Leprdb/db and Leprdb/m are highlighted in the volcano plot. (D) Genes were annotated into three primary Gene Ontology (GO) terms: Biological Process (BP), Cellular Component (CC), and Molecular Function (MF). (E) Wilcoxon rank-sum test was performed on blood RNA-seq data (GSE154881) to identify differentially expressed genes. (F–H) Protein level of SIRT6 in db/db mice, HFD rats, and VSMCs. I–K) SIRT6 foci in diabetic patients (scale bars, 100 μm), db/db mice (scale bars, 50 μm), and HFD rats (scale bars, 100 μm). (L) Confocal microscopy showing SIRT6 (red) co-localization with nuclei (blue) in VSMCs. Scale bars, 20 μm. (M − P) Protein levels of SIRT6 in nucleus and cytoplasm of diabetic patients, db/db mice, HFD/STZ rats and VSMCs. n = 3∼4. All quantitative data are demonstrated as mean ± SD from independent experiments. ∗P < 0.05, ∗∗P < 0.01, ∗∗∗P < 0.001 versus NC, db/m, NCD or Control; #P < 0.05, ##P < 0.01, ###P < 0.001 versus db/db, HFD/STZ or HG + Pal by unpaired t-test.
Fig. 3
Fig. 3
HG/Pal conditions drive oxidative stress-mediated SIRT6 nuclear export via IPO13. (A, B) The total cytoplasmic ROS levels were detected by using DCFH (green fluorescence) and DHE (red fluorescence). (C) The mRNA level of antioxidant genes. (D, E) The H2O2 levels in VSMCs and the nucleus were detected. F) Protein levels of SIRT6 in the nucleus and cytoplasm of VSMCs. (G) Confocal microscopy showing SIRT6 (red) co-localization with nuclei (blue) in VSMCs. Scale bars, 20 μm. (H) Protein docking model of SIRT6 (PDB ID: 6HOY) and the IPO13 (AlphaFold ID: AF-O94829-F1) and the interacting residues in the docked complex. (I) Interaction between SIRT6 and IPO13 was detected by CO-IP. (J) Laser confocal microscopy detection of mean fluorescence intensity and nuclear translocation of IPO13. Scale bar, 20 μm). (K) Protein level of IPO13. (L) Protein levels of SIRT6 in the nuclear and cytoplasmic fractions of VSMCs following transfection with si-IPO13 plasmid. n = 3∼4. All quantitative data are demonstrated as mean ± SD from independent experiments.ΔP < 0.05, ΔΔP < 0.01, ΔΔΔP < 0.001 versus H2O2; ∗P < 0.05, ∗∗P < 0.01, ∗∗∗P < 0.001 versus db/m or Control; #P < 0.05, ##P < 0.01, ###P < 0.001 versus db/db or HG + Pal by unpaired t-test or ordinary one-way ANOVA.
Fig. 4
Fig. 4
Cytoplasmic accumulation of SIRT6 promotes VSMC proliferation. (A) Distribution of SIRT6 in VSMCs transfected with si-SIRT6 plasmid. Scale bars, 20 μm. (B) Distribution of SIRT6 in VSMCs transfected with SIRT6WT plasmid. Scale bars, 20 μm. (C) Model of exogenous administration of SIRT6 overexpression plasmid in db/db mice. (D) Protein level of SIRT6 after administration of SIRT6 overexpression plasmid in db/db mice. (E) Ki67 foci in db/db mice. Scale bars, 50 μm. (F) PCNA foci in db/db mice. Scale bars, 50 μm. (G) MMP9 foci in db/db mice. Scale bars, 50 μm. (H) Protein level of SIRT6 in VSMC. (I) Ki67 foci in KO-Sirt6 VSMC. Scale bars, 20 μm. (J) PCNA foci in KO-Sirt6 VSMC. Scale bars, 20 μm. (K) Cell viability of rat aortic VSMC measured by CCK-8. (L) Expression of VSMC phenotype switch-related protein. n = 3∼5. All quantitative data are demonstrated as mean ± SD from independent experiments. ∗P < 0.05, ∗∗P < 0.01, ∗∗∗P < 0.001 versus Control; #P < 0.05, ##P < 0.01, ###P < 0.001 versus db/db HG + Pal or KO-Sirt6 by unpaired t-test or ordinary one-way ANOVA.
Fig. 5
Fig. 5
SIRT6-ENO3 interaction promotes glycolytic flux in diabetic VSMCs. (A) Kyoto Encyclopedia of Genes and Genomes (KEGG) enrichment analysis of differentially expressed genes of the control group and HG + Pal treated rat aortic VSMCs identified by RNA-Seq. (B) Heatmap showing differentially expressed glycolysis genes in the control and HG + Pal groups. (C) Gene expression of glycolysis was conducted by RT-qPCR. (D) Acetylation of β-Enolase detected by LC-MS/MS analysis. (E) Venn diagram depicting overlap among the acetylation protein and differentially expressed glycolysis genes by acetylome and RNA-Seq. (F) Protein levels of ENO1, ENO2, and ENO3. (G) Scheme of experiment design of Co-Immunoprecipitation Mass Spectrometry (Co-IP-MS) analysis. Cell lysates extracted from aortic tissues of db/db mice were co-immunoprecipitated with SIRT6 antibody, followed by MS detection. (H) Gene Ontology (GO) categories of proteins that were identified in Co-IP-MS in the aortic tissues of db/db mice. (I) Protein docking model of SIRT6 (PDB ID: 6HOY) and the ENO3 (AlphaFold ID: AF-P13929-F1) and the interacting residues in the docked complex. (J) Immunoprecipitation assay for detecting the interaction between SIRT6 and ENO3 in db/db mice. (K) Interaction between SIRT6 and ENO3 detected by immunoprecipitation assay in the cytoplasm. (L) Detecting the interaction between SIRT6 and ENO3 in HEK293T cells. (M) Representative images of results obtained to investigate SIRT6 and ENO3 interaction by Duolink in situ proximity ligation assay (PLA) assay in VSMCs. The mouse and rabbit IgG antibodies were used as controls. Scale bars, 5 μm. (N) The acetylation level of ENO3 was detected by Co-IP and Western blot analysis. (O) Activity of ENO3 in VSMCs. (P) Schematic illustration of U–13C labeled metabolomics. (Q) Heatmap showing differentially expressed metabolites in the two groups. (R) Rate of pyruvate production in VSMCs. (S) The lactic acid content of rat aortic VSMCs. (T) Normalized and quantification of glycoPER in rat aortic VSMCs. (U) Normalized and quantification of glycoPER in Sirt6-KO Movas. n = 3∼6. All quantitative data are demonstrated as mean ± SD from independent experiments. ΔP < 0.05, ΔΔP < 0.01, ΔΔΔP < 0.001 versus H2O2; ∗P < 0.05, ∗∗P < 0.01, ∗∗∗P < 0.001 versus Control; #P < 0.05, ##P < 0.01, ###P < 0.001 versus HG + Pal or KO-Sirt6 by unpaired t-test or ordinary one-way ANOVA.
Fig. 6
Fig. 6
Exogenous hydrogen sulfide restores CSE/H2S signaling and inhibits SIRT6 cytoplasmic translocation in diabetic VSMCs. (A) Heatmap showing differentially expressed genes related to hydrogen sulfide synthesis and metabolism in the two groups. (B) Representative immunohistochemistry (IHC) staining images of CSE in the aorta of db/db mice and HFD/STZ rats. Scale bars, 50 μm. (C) Protein level of CSE in db/db mice. (D) Protein level of CSE in VSMCs. (E) Protein level of CSE in NaHS and GYY-treated VSMCs. (F) H2S content detected by 7-azido-4-methylcoumarin (C-7Az) in db/db mice. Scale bars, 50 μm. (G) H2S content detected by C-7Az in HFD/STZ rats. Scale bars, 100 μm. (H, I) Ki67 foci in db/db mice. Scale bars, 50 μm. (J, K) SIRT6 foci in db/db mice. Scale bars, 50 μm. (L) Confocal microscopy showing SIRT6 (red) co-localization with nuclei (blue) in VSMCs. Scale bars, 20 μm. (M, N) Protein levels of SIRT6 in nucleus and cytoplasm of VSMCs and db/db mice. (O) The expression of VSMC phenotype switch-related protein. n = 3∼4. All quantitative data are demonstrated as mean ± SD from independent experiments. ΔP < 0.05, ΔΔP < 0.01, ΔΔΔP < 0.001 versus H2O2; ∗P < 0.05, ∗∗P < 0.01, ∗∗∗P < 0.001 versus Control, db/m or NCD; #P < 0.05, ##P < 0.01, ###P < 0.001 versus HG + Pal, db/db or HFD/STZ by unpaired t-test or ordinary one-way ANOVA.
Fig. 7
Fig. 7
H2S suppresses glycolysis via promoting ENO3 acetylation through S-sulfhydration of SIRT6. (A) Model of biotin transformation experiment. (B, C) S-sulfhydration levels of SIRT6 in db/db mice and HFD/STZ rats. (D) Kyoto Encyclopedia of Genes and Genomes (KEGG) enrichment analysis of differentially expressed genes of HG + Pal and GYY treated rat aortic VSMCs identified by RNA-Seq. (E) Heatmap showing differentially expressed glycolysis genes in the HG + Pal and GYY groups. (F) Protein level of ENO3. (G) ENO3 foci in db/db mice were injected via the tail vein with adeno-associated virus (AAV)-mediated overexpression of CSE. (H) The interaction between SIRT6 and ENO3 in cytoplasm was detected by immunoprecipitation assay. (I) The acetylation level of different proteins detected by acetylome between the db/db and db/db + GYY groups is highlighted in the volcano plot. (J) The acetylation level of ENO3 was detected by Co-IP and Western blot analysis. (K) Activity of ENO3 in VSMCs. (L) Normalized ECAR of VSMCs. (M) Quantification of ECAR. (N) Normalized OCR of VSMCs. (O) Quantification of ECAR. n = 3∼4. All quantitative data are demonstrated as mean ± SD from independent experiments. ∗P < 0.05, ∗∗P < 0.01, ∗∗∗P < 0.001 versus Control or db/m; #P < 0.05, ##P < 0.01, ###P < 0.001 versus HG + Pal or db/db by ordinary one-way ANOVA.
Fig. 8
Fig. 8
H2S modulates VSMC proliferation by modifying SIRT6 at Cys141. (A) S-sulfhydration of SIRT6 detected by LC-MS/MS analysis. (B) S-sulfhydration levels of SIRT6 in db/db mice. (C) Representative photographs of H&E-stained sections of the arterial tissue. (D) Ki67 foci in db/db mice. Scale bars,50 μm. (E) PCNA foci in db/db mice. (F) Confocal microscopy showing SIRT6 (red) co-localization with nuclei (blue) in VSMCs. Scale bars, 20 μm. (G) S-sulfhydration levels of VSMCs. (H) Cell viability of rat aortic VSMC measured by CCK-8. (I) Ki67 foci in KO-Sirt6 VSMCs. Scale bars,50 μm. (J) Normalized and quantification of glycoPER in rat aortic VSMCs. (K) Activity of ENO3 in VSMCs. (L) The expression of VSMC phenotype switch-related protein. (M) Pie charts represent the three disease-related genes for aortic aneurysm, aortic coarctation, and atherosclerosis obtained from the MALAcards database. (N) Volcano plot of differentially expressed genes. Downregulation and upregulation were shown in the blue and red dots, respectively. Data were obtained from the GEO database (GSE 213425). (O) Venn diagram depicting the overlap between expressed genes and disease genes. (P, Q) Pearson correlation of SIRT6 and atherosclerosis-related genes obtained from microarray data (GSE28829). (R) Venn diagram depicting overlap among differentially expressed genes, disease genes, and SIRT6-related genes. n = 3∼5. All quantitative data are demonstrated as mean ± SD from independent experiments. ∗P < 0.05, ∗∗P < 0.01, ∗∗∗P < 0.001 versus Control; #P < 0.05, ##P < 0.01, ###P < 0.001 versus HG + Pal, db/db, KO-Sirt6 by ordinary one-way ANOVA.

References

    1. Zucatti K.P., Teixeira P.P., Wayerbacher L.F., Piccoli G.F., Correia P.E., Fonseca N.K.O., et al. Long-term effect of lifestyle interventions on the cardiovascular and all-cause mortality of subjects with prediabetes and type 2 diabetes: a systematic review and meta-analysis. Diabetes Care. 2022;45:2787–2795. doi: 10.2337/dc22-0642. - DOI - PubMed
    1. Xie J., Wang M., Long Z., Ning H., Li J., Cao Y., et al. Global burden of type 2 diabetes in adolescents and young adults, 1990-2019: systematic analysis of the global burden of disease study 2019. Bmj. 2022;379 doi: 10.1136/bmj-2022-072385. - DOI - PMC - PubMed
    1. Cho N.H., Shaw J.E., Karuranga S., Huang Y., da Rocha Fernandes J.D., Ohlrogge A.W., Malanda B. IDF diabetes Atlas: global estimates of diabetes prevalence for 2017 and projections for 2045. Diabetes Res. Clin. Pract. 2018;138:271–281. doi: 10.1016/j.diabres.2018.02.023. - DOI - PubMed
    1. Gregg E.W., Sattar N., Ali M.K. The changing face of diabetes complications. Lancet Diabetes Endocrinol. 2016;4:537–547. doi: 10.1016/s2213-8587(16)30010-9. - DOI - PubMed
    1. Shi J., Yang Y., Cheng A., Xu G., He F. Metabolism of vascular smooth muscle cells in vascular diseases. Am. J. Physiol. Heart Circ. Physiol. 2020;319:H613–h631. doi: 10.1152/ajpheart.00220.2020. - DOI - PubMed

LinkOut - more resources