Comparative Study
. 2025 Jul 1;42(7):msaf152.
doi: 10.1093/molbev/msaf152.

Comparative Analysis of Mammalian Adaptive Immune Loci Revealed Spectacular Divergence and Common Genetic Patterns

Affiliations
Comparative Study

Comparative Analysis of Mammalian Adaptive Immune Loci Revealed Spectacular Divergence and Common Genetic Patterns

Mariia Pospelova et al. Mol Biol Evol. .

Abstract

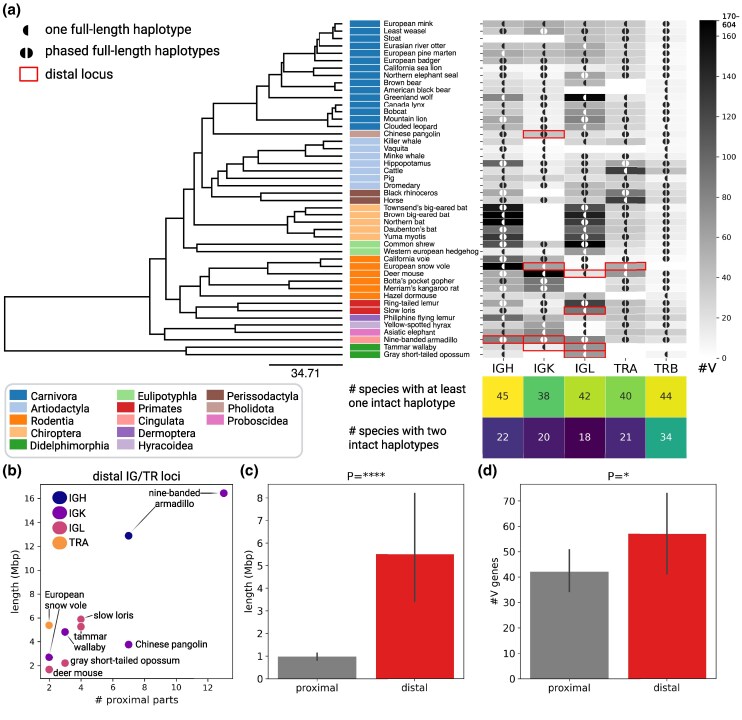
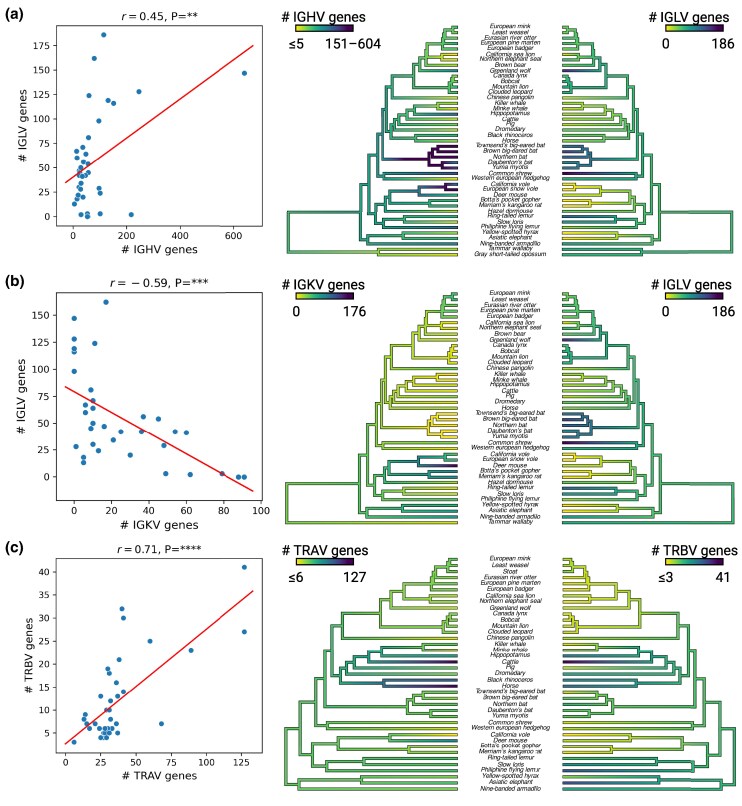
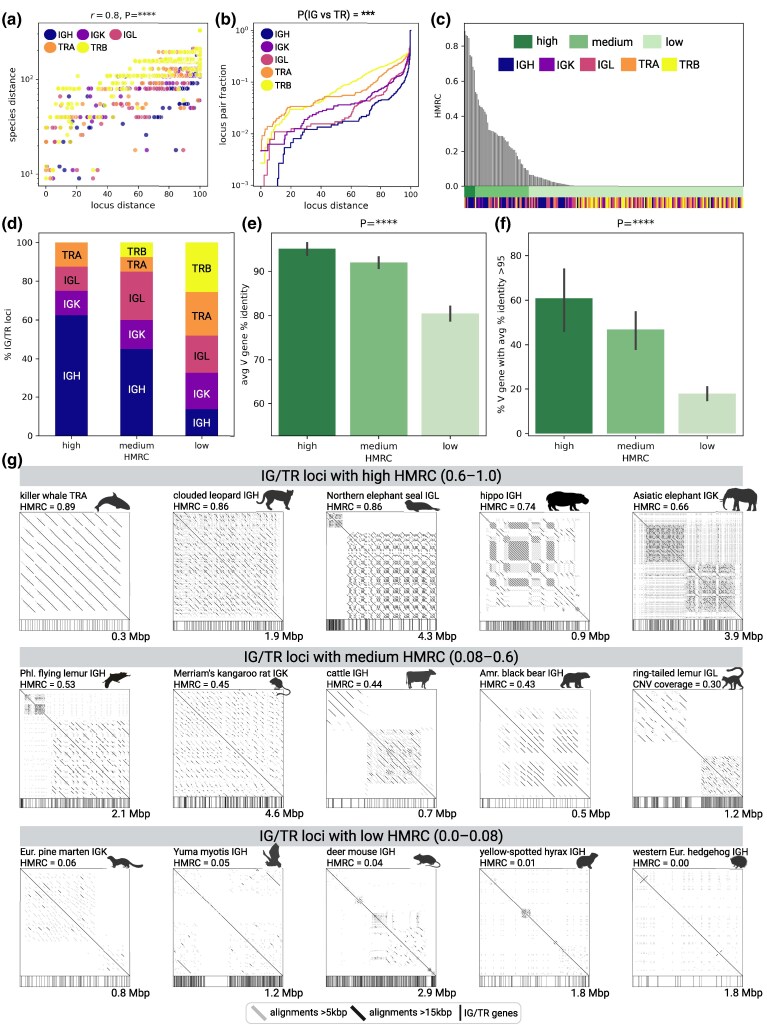
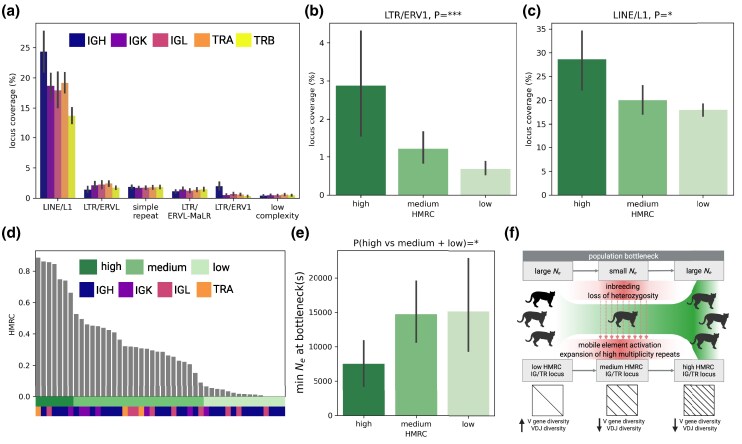
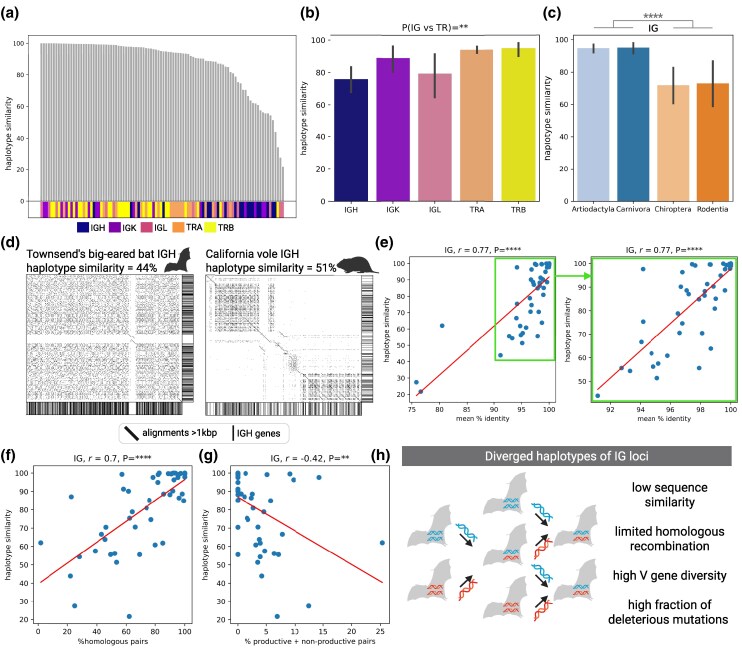
Adaptive immune responses are mediated by the production of adaptive immune receptors, antibodies, and T-cell receptors, which bind antigens, thus causing their neutralization. Unlike other proteins, adaptive immune receptors are not fully encoded in the germline genome and result from a complex of somatic processes collectively called V(D)J recombination affecting germline immunoglobulin (IG) and T-cell receptor (TR) loci consisting of template genes. While various existing studies report extreme diversity of antibodies and T-cell receptors, little is known about the diversity of germline IG and TR loci. To overcome this gap, the first comparative analysis of full-length sequences of IG/TR loci across 46 mammalian species from 13 taxonomic orders was performed. First, germline gene counts were shown to correlate in immunoglobulin heavy chain immunoglobulin heavy chain (IGH)/immunoglobulin lambda (IGL) loci and T-cell receptor alpha (TRA)/T-cell receptor beta (TRB) and anticorrelate in immunoglobulin kappa (IGK)/IGL, possibly indicating coevolution between corresponding chains. Second, structures of IG/TR loci were analyzed, and it was shown that IG/TR loci formed by long arrays of high multiplicity repeats are more common for species that have experienced population bottlenecks. Finally, haplotypes of IG/TR loci with little or no sequence similarity within a species were found, suggesting that they may have a limited potential for homologous recombination. These results demonstrate that IG/TR loci are rapidly evolving genomic regions whose structural variation is shaped by the population history of the species and open new perspectives for immunogenomics studies.

Keywords: T-cell receptor loci; adaptive immunity; genomics; immunogenomics; immunoglobulin loci; structural variations.


Conflict of interest statement

Conflict of Interest: C.T.W. is a cofounder/CSO of Clareo Biosciences, Inc.

Figures

Fig. 1.
Fig. 1.
Overview of IG/TR loci collected across 46 mammalian species. a) The phylogenetic tree of mammalian species selected for the analysis. The tree was constructed using consensus topologies derived from 100 trees obtained from VertLife.org (Upham et al. 2019). The final consensus tree was generated with TreeAnnotator v1.10.4 (Drummond and Rambaut 2007) using mean node heights. Taxonomic orders are shown next to the species names. Counts of productive V genes in IGH, IGK, IGL, TRA, and TRB loci are shown on the heatmap on the right. Distal IG/TR loci are shown as red rectangles. A locus is marked with ◖/◖◗ if it has one/two intact haplotype(s) assembled. Counts of species with one/two intact haplotype(s) of IG/TR loci are summarized in the heatmap below. b) Number of proximal parts versus the total locus length across ten distal IG/TR loci. c) Lengths of proximal and distal IG/TR loci. Here and further error bars represent 95% confidence intervals; P-values are denoted as follows: ns: P ≥ 0.05; *<0.05, **<0.01, ***<0.001, ****<0.0001; and P-values are computed using the Kruskal–Wallis test unless specified otherwise. d) Counts of productive V genes in proximal and distal IG/TR loci.
Fig. 2.
Fig. 2.
Correlations between productive V gene counts in proximal IG/TR loci. a) Counts of IGHV and IGLV genes across 38 species. Only species with at least one reconstructed IGH locus and at least one reconstructed IGL locus were chosen. Pearson's correlation and the corresponding P-value are shown at the top of the plot. The line shows the linear trend. The trees on the right show the species tree colored according to IGHV and IGLV gene counts, from light (0) to dark (the maximum V gene number). The species tree from Fig. 1 was used, and the gene counts were visualized with the contMap function from the phytools R package (Revell 2024). b) Counts of IGKV and IGLV genes across 34 species. c) Counts of TRAV and TRBV genes across 39 species. Legends of b) and c) are consistent with a).
Fig. 3.
Fig. 3.
High multiplicity repeat content (HMRC) in IG/TR loci. a) Locus distance versus species distance for all pairs of IG/TR loci of the same chain types. Points are colored according to the locus chain type. The species distances are shown in the logarithmic scale. Pearson's correlation and P-value are shown at the top of the plot. b) The cumulative histograms of locus distance values for five chain types. c) HMRC of IG/TR loci sorted in descending order of the values. Each bar is colored in shades of green according to the HMRC class: high (dark), medium (medium), low (pale), and chain type (colors are consistent with a). d) Fraction of each locus type in each of three HMRC classes. e) Average percent identity of productive V genes in IG/TR loci across three HMRC classes. f) The fraction of productive V genes with at least 95% similarity to another V gene in the same locus across three HMRC classes. g) Examples of IG/TR loci with high, medium, and low HMRC. Each locus is shown as a dot plot, alignments longer than 15 (5) kbp are shown in black (gray). Positions of IG/TR genes are shown along the bottom of each plot.
Fig. 4.
Fig. 4.
Characteristics of IG/TR loci with high, medium, and low HMRC. a) Percentages of sequences covered by LINE/L1, LTR/ERVL, simple repeats, LTR/ERVL-MalR, LTR/ERV1, and low complexity repeats across five types of IG/TR loci. b) Percentages of IG/TR loci covered by LTR/ERVL repeats across three HMRC classes. c) Percentages of IG/TR loci covered by LINE/L1 repeats across three HMRC classes. d) HMRC values (max HMRC value per species) sorted in descending order. Bars along the bottom show HMRC classes and the type of the corresponding locus. e) The minimum Ne value during population bottlenecks across three HMRC classes for nonclosely related species. f) A hypothesis showing links between population bottlenecks, loss of heterozygosity, activation of mobile elements, and high multiplicity repeat expansion in IG/TR loci.
Fig. 5.
Fig. 5.
The variation of IG/TR locus haplotypes. a) Haplotype similarities computed across 98 pairs of IG/TR haplotypes and sorted in descending order. The horizontal bar on the bottom shows IG/TR locus types. b) Haplotype similarities across five types of IG/TR loci. P-value at the top shows differences between haplotype similarities values in IG and TR loci. c) Haplotype similarities of IG haplotypes in four orders: Artiodactyla, Carnivora, Chiroptera, and Rodentia. The P-value at the top corresponds to differences between combined Artiodactyla and Carnivora IG haplotype similarities and combined Chiroptera and Rodentia IG haplotype similarities. d) Dot plots of diverged haplotypes of the Townsend's big-eared bat IGH locus (left) and the California vole IGH (right). Only alignments longer than 1 kbp are shown. Bars along the bottom and the right of each plot show positions of IGH genes. e) Haplotype similarity versus average V gene similarity in IG haplotypes across all haplotype pairs (left) and all haplotypes without three outliers in the lower left corner (right). Pearson's correlation and corresponding P-values are shown at the top of each plot here and further. f) Haplotype similarity versus percentage of homologous V gene pairs across all IG haplotypes. g) Haplotype similarity versus percentage of V gene pairs with one productive and one nonproductive gene across all IG haplotypes. h) A hypothetical scenario resulting in highly diverged IG haplotypes and their characteristics summarizing panels e)–g).

Similar articles

Cited by

References

    1. Alberts B, Johnson A, Lewis J, Raff M, Roberts K, Walter P. The generation of antibody diversity. In Molecular biology of the cell. 4th ed. Garland Science; 2002. Chapter 24. https://www.ncbi.nlm.nih.gov/books/NBK21054/.
    1. Banach BB, Cerutti G, Fahad AS, Shen CH, De Souza MO, Katsamba PS, Tsybovsky Y, Wang P, Nair MS, Huang Y, et al. Paired heavy-and light-chain signatures contribute to potent SARS-CoV-2 neutralization in public antibody responses. Cell Rep. 2021:37(1):109771. 10.1016/j.celrep.2021.109771. - DOI - PMC - PubMed
    1. Barra V, Fachinetti D. The dark side of centromeres: types, causes and consequences of structural abnormalities implicating centromeric DNA. Nat Commun. 2018:9(1):4340. 10.1038/s41467-018-06545-y. - DOI - PMC - PubMed
    1. Bratsch S, Wertz N, Chaloner K, Kunz TH, Butler JE. The little brown bat, M. lucifugus, displays a highly diverse VH, DH and JH repertoire but little evidence of somatic hypermutation. Dev Comp Immunol. 2011:35(4):421–430. 10.1016/j.dci.2010.06.004. - DOI - PubMed
    1. Briney B, Inderbitzin A, Joyce C, Burton DR. Commonality despite exceptional diversity in the baseline human antibody repertoire. Nature. 2019:566(7744):393–397. 10.1038/s41586-019-0879-y. - DOI - PMC - PubMed

Publication types

Substances

LinkOut - more resources