

Newly Developed Structure-Based Methods Do Not Outperform Standard Sequence-Based Methods for Large-Scale Phylogenomics
- PMID: 40580945
- PMCID: PMC12290511
- DOI: 10.1093/molbev/msaf149
Newly Developed Structure-Based Methods Do Not Outperform Standard Sequence-Based Methods for Large-Scale Phylogenomics
Abstract
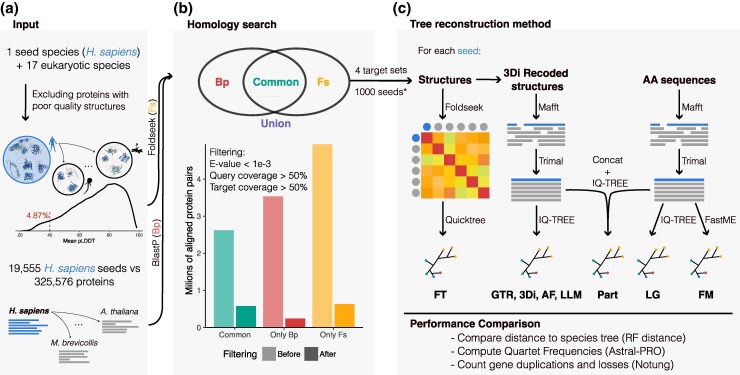
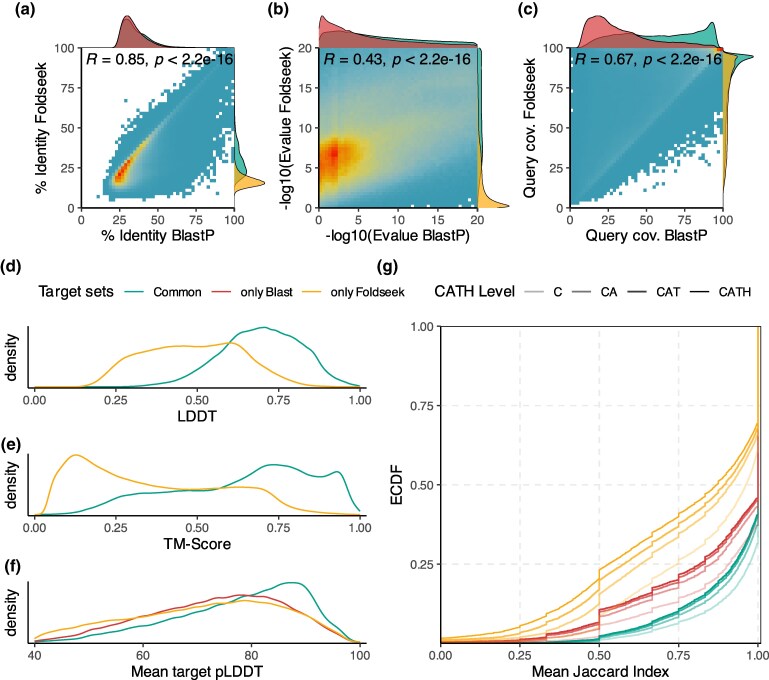
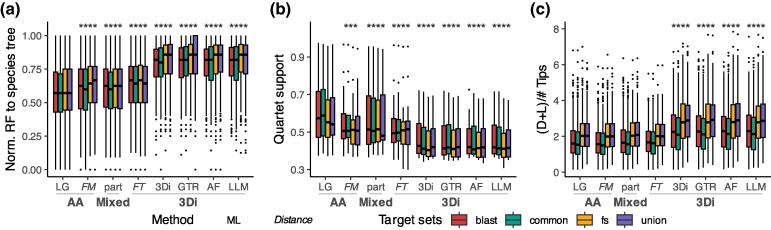
Recent developments in protein structure prediction have allowed the use of this previously limited source of information at genome-wide scales. It has been proposed that the use of structural information may offer advantages over sequences in phylogenetic reconstruction, due to their slower rate of evolution and direct correlation to function. Here, we examined how recently developed methods for structure-based homology search and tree reconstruction compare with current state-of-the-art sequence-based methods in reconstructing genome-wide collections of gene phylogenies (i.e. phylomes). While structure-based methods can be useful in specific scenarios, we found that their current performance does not justify using the newly developed structure-based methods as a default choice in large-scale phylogenetic studies. On the one hand, the best performing sequence-based tree reconstruction methods still outperform structure-based methods for this task. On the other hand, structure-based homology detection methods provide larger lists of candidate homologs, as previously reported. However, this comes at the expense of missing hits identified by sequence-based methods, as well as providing sets of homolog candidates with higher fractions of false positives. These insights help to guide the use of structural data in comparative genomics and highlight the need to continue improving structure-based approaches. Our pipeline is fully reproducible and has been implemented in a Snakemake workflow. This will facilitate a continuous assessment of future improvements of structure-based tools in the AlphaFold era.
Keywords: homology; orthology; phylogenetics; phylome; structural phylogenetics.
© The Author(s) 2025. Published by Oxford University Press on behalf of Society for Molecular Biology and Evolution.
Figures
Similar articles
-
The Black Book of Psychotropic Dosing and Monitoring.Psychopharmacol Bull. 2024 Jul 8;54(3):8-59. Psychopharmacol Bull. 2024. PMID: 38993656 Free PMC article. Review.
-
Systemic Inflammatory Response Syndrome.2025 Jun 20. In: StatPearls [Internet]. Treasure Island (FL): StatPearls Publishing; 2025 Jan–. 2025 Jun 20. In: StatPearls [Internet]. Treasure Island (FL): StatPearls Publishing; 2025 Jan–. PMID: 31613449 Free Books & Documents.
-
Management of urinary stones by experts in stone disease (ESD 2025).Arch Ital Urol Androl. 2025 Jun 30;97(2):14085. doi: 10.4081/aiua.2025.14085. Epub 2025 Jun 30. Arch Ital Urol Androl. 2025. PMID: 40583613 Review.
-
Systemic pharmacological treatments for chronic plaque psoriasis: a network meta-analysis.Cochrane Database Syst Rev. 2021 Apr 19;4(4):CD011535. doi: 10.1002/14651858.CD011535.pub4. Cochrane Database Syst Rev. 2021. Update in: Cochrane Database Syst Rev. 2022 May 23;5:CD011535. doi: 10.1002/14651858.CD011535.pub5. PMID: 33871055 Free PMC article. Updated.
-
The Lived Experience of Autistic Adults in Employment: A Systematic Search and Synthesis.Autism Adulthood. 2024 Dec 2;6(4):495-509. doi: 10.1089/aut.2022.0114. eCollection 2024 Dec. Autism Adulthood. 2024. PMID: 40018061 Review.
Cited by
-
The evolutionary history and modern diversity of triterpenoid cyclases.bioRxiv [Preprint]. 2025 Aug 2:2024.10.28.620730. doi: 10.1101/2024.10.28.620730. bioRxiv. 2025. Update in: Mol Biol Evol. 2025 Aug 19:msaf203. doi: 10.1093/molbev/msaf203. PMID: 40766600 Free PMC article. Updated. Preprint.
-
Protein Structural Phylogenetics.Genome Biol Evol. 2025 Jul 30;17(8):evaf139. doi: 10.1093/gbe/evaf139. Genome Biol Evol. 2025. PMID: 40839422 Free PMC article. Review.
References
-
- Edgar RC. Sequence alignment using large protein structure alphabets improves sensitivity to remote homologs. bioRxiv 2024.05.24.595840. 10.1101/2024.05.24.595840, 9 June 2024, preprint: not peer reviewed. - DOI
MeSH terms
Grants and funding
- LCF/BQ/DI22/11940014/"Caixa" Foundation
- FJC2021-046869-I/"Caixa" Foundation
- MCIN/AEI/10.13039/501100011033/"Caixa" Foundation
- "European Union" NextGenerationEU/PRTR
- BP 2022, file number BP 00075/Beatriu de Pinós programme
- ID 100010434/"La Caixa" Foundation
- PID2021-126067NB-I00/Spanish Ministry of Science and Innovation
- CPP2021-008552/Spanish Ministry of Science and Innovation
- PCI2022-135066-2/Spanish Ministry of Science and Innovation
- PDC2022-133266-I00/Spanish Ministry of Science and Innovation
- SGR01551/Catalan Research Agency (AGAUR)
- ERC-2016-724173/European Union's Horizon 2020 research and innovation programme
- GBMF9742/Gordon and Betty Moore Foundation
- LCF/PR/HR21/00737/"La Caixa" foundation
- IMP/00019/Instituto de Salud Carlos III
- CIBERINFEC CB21/13/00061-ISCIII-SGEFI/ERDF/Instituto de Salud Carlos III
LinkOut - more resources
Full Text Sources
