. 2025 Jul 15;6(7):102207.
doi: 10.1016/j.xcrm.2025.102207. Epub 2025 Jun 27.

Enhancing 3D dopamine transporter imaging as a biomarker for Parkinson's disease via self-supervised learning with diffusion models

Affiliations

Enhancing 3D dopamine transporter imaging as a biomarker for Parkinson's disease via self-supervised learning with diffusion models

Jongjun Won et al. Cell Rep Med. .

Abstract

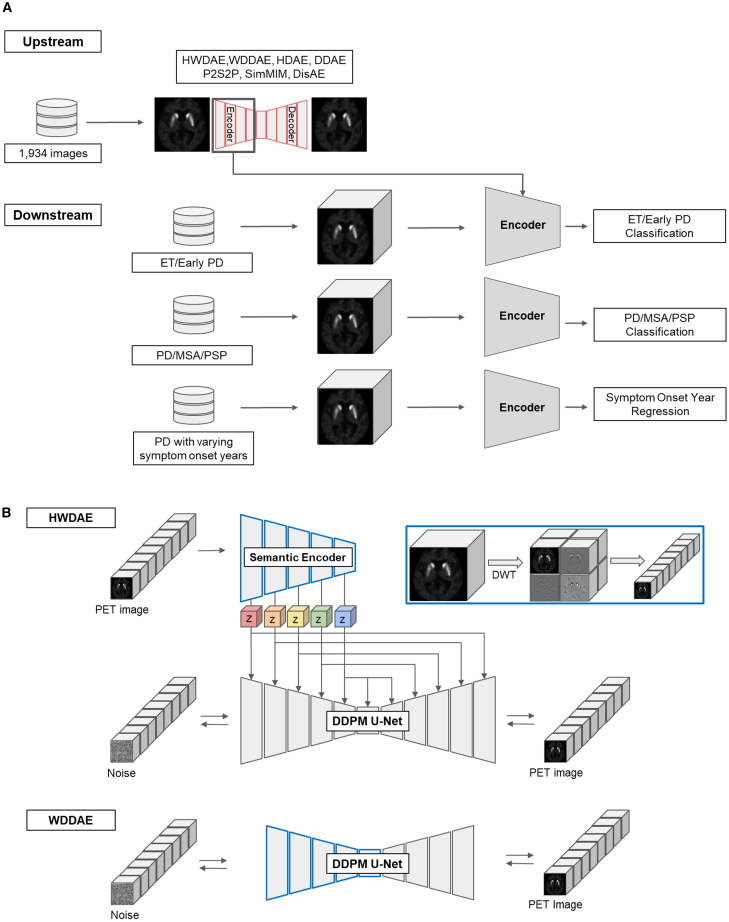
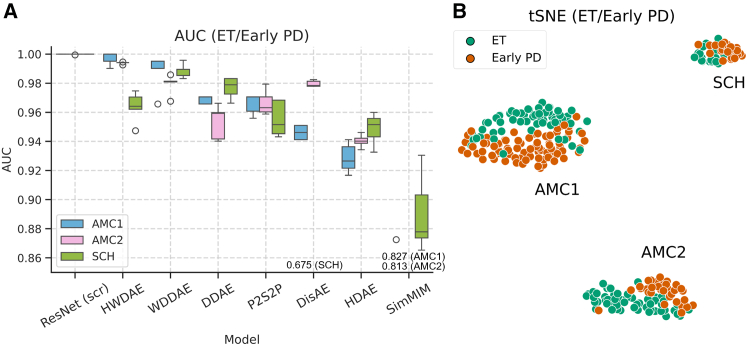
Accurate diagnosis and precise estimation of disease progression states are crucial for developing effective treatment plans for patients with parkinsonism. Although various deep learning-based computer-aided diagnostic models have demonstrated benefits, they have been relatively underexplored in parkinsonism owing to limited data and lack of external validation. We introduce the hierarchical wavelet diffusion autoencoder (HWDAE), a generative self-supervised model trained with 1,934 dopamine transporter positron emission tomography (DAT PET) images. HWDAE learns relevant disease traits during generative training, prior to supervision with human labels, as evidenced by its ability to synthesize realistic images representing different disease states of Parkinson's disease. The pretrained HWDAE is subsequently adapted for two differential diagnostic tasks and one disease progression estimation task, tested on images from two medical centers. Our training approach introduces a paradigm for deep learning research utilizing PET and expands the potential of DAT PET as a biomarker for Parkinson's disease.

Keywords: Parkinson’s disease; biomarker; deep learning; diffusion model; dopamine transporter; generative model; parkinsonism; positron emission tomography; self-supervised learning.


Conflict of interest statement

Declaration of interests The authors declare no competing interests.

Figures

None
Graphical abstract
Figure 1
Figure 1
Overall workflow and model architectures (A) Workflow from upstream to downstream tasks. (B) Simplified architectures of the HWDAE and WDDAE, with input images preprocessed using discrete wavelet transform (DWT). The encoders of the HWDAE and WDDAE used in the downstream tasks are highlighted as blue lines. The HDAE and DDAE have similar architectures to those of the HWDAE and WDDAE, respectively, but lack DWT preprocessing and include an additional layer in the encoder and decoder of the U-Net architecture.
Figure 2
Figure 2
Data composition of downstream tasks (A) Data composition of the EP task depicted using heatmap. (B) Data composition of the PMP task. (C) Data composition of the SOY task. The total number, median, quartile 1, and quartile 3 values are provided for each training/test set. See also Figure S2 and Table S1.
Figure 3
Figure 3
Boxplot and t-SNE of the EP task (A) AUC of each model across test sets. For each model and test set, five AUC values from 5-fold cross-validation are depicted in a boxplot. Models are listed in the decreasing order of the AUC on the test set AMC1. (B) t-SNE drawn using the latent space of the HWDAE. Each circle corresponds to each PET image. Images from both training and test sets are included. See also Figures S3 and S7 and Tables S2, S12, and S14.
Figure 4
Figure 4
Bar plots and t-SNE of the PMP task Models are listed in the decreasing order of AP with fine-tuning on the test set AMC1. (A) Mean macro-averaged AP. (B) t-SNE drawn using the latent space of the third block of the HWDAE after fine-tuning. (C) Mean AP of PD versus others. (D) Mean AP of MSA versus others. (E) Mean AP of PSP versus others. (F) Mean AUC. (G) Mean micro-averaged AP. (H) Mean weighted F1 score of upstream models with fine-tuning. Thick lines in each bar represent the results of the model trained from scratch. Error bars and transparent ranges around dashed lines denote the 95% confidence intervals. See also Figures S4, S5, S8–S10, and S15 and Tables S3–S8, S10–S11, S13, and S15.
Figure 5
Figure 5
Bar, scatter, and Bland-Altman plots of the SOY task Models are listed in the decreasing order of R2 with fine-tuning on the test set AMC1. (A) Bar plot of mean R2. (B) Bar plot of mean CCC. The scatter and Bland-Altman plots were generated using the upstream model with the highest mean R2 in each test set. (C) Scatterplot of predicted vs. true onset years with a regression line and p value for AMC1 using the WDDAE upstream model. (D) Scatterplot for AMC2 using the HWDAE upstream model. (E) Bland-Altman plot for AMC1 using the WDDAE upstream model. (F) Bland-Altman plot for AMC2 using the HWDAE upstream model. The y axis was calculated by subtracting the ground truth from the model-predicted values. See also Figures S6 and S11 and Tables S9 and S16.
Figure 6
Figure 6
t-SNE, scatter, and line plots of the SOY task comparing baseline and follow-ups (A and B) were plotted with the training and test sets of AMC1. The onset years were categorized into 12 classes. (C–E) Compare the baseline and follow-up images of the 30 patients with PD. All images were generated using the WDDAE after fine-tuning. (A) t-SNE of the latent space. (B) Mean of each class (0–11∼) added to (A). (C) Scatterplot of predicted vs. true onset year gap between the baseline and follow-up images with a regression line and p value. (D) Latent of baseline and follow-up images added to (A). The arrows connect the baseline and follow-up latents of the same patients, and the numbers next to the circles denote the true onset years. (E) Line plot of each patient’s true and predicted onset years with the baseline and follow-up images. Each patient is represented by a pair of red and blue lines.
Figure 7
Figure 7
t-SNE and latent space manipulation using HWDAE without fine-tuning (A–E) Plotted using (A–C) both AMC1 training/test set and AMC2 test set and (D and E) using AMC1 training/test set only. (A) t-SNE of images from patients with PD vs. those diagnosed with either vascular parkinsonism, drug-induced parkinsonism, or ET, all of whom had normal PET findings. (B) t-SNE of images from patients with PD vs. MSA vs. PSP. (C) t-SNE of images from patients with PD grouped by symptom onset years. (D) t-SNE of images from the patients with normal PET findings as in (A) and patients with PD grouped by symptom onset years. The mean latent vector of each group and four direction vectors. (E) Latent of baseline and follow-up images of the 30 patients added to (D). The arrows connect the baseline and follow-up latents of the same patients, and the numbers next to circles denote the true onset years. (F) Example input and manipulated images. The input images were from patients with normal PET findings and with symptom onset years of <5 years, <5 years, and ≥5 years, corresponding to dir1 through dir4 from (D), respectively. The manipulated images are arranged in the order of increasing multiplication factors of each direction vector. See also Figures S12–S15.

Similar articles

References

    1. Ben-Shlomo Y., Darweesh S., Llibre-Guerra J., Marras C., San Luciano M., Tanner C. The epidemiology of Parkinson's disease. Lancet. 2024;403:283–292. doi: 10.1016/S0140-6736(23)01419-8. - DOI - PMC - PubMed
    1. Food and Drug Administration. FDA DaT Scan Approval Letter. (2011). https://www.accessdata.fda.gov/drugsatfda_docs/label/2011/022454Orig1s00....
    1. Summary of the European Public Assessment Report for DaTSCAN. (2011). ema.europa.eu/en/medicines/human/EPAR/datscan#product-information-section.
    1. Hastings A., Cullinane P., Wrigley S., Revesz T., Morris H.R., Dickson J.C., Jaunmuktane Z., Warner T.T., De Pablo-Fernández E. Neuropathologic Validation and Diagnostic Accuracy of Presynaptic Dopaminergic Imaging in the Diagnosis of Parkinsonism. Neurology. 2024;102 doi: 10.1212/WNL.0000000000209453. - DOI - PubMed
    1. Bega D., Kuo P.H., Chalkidou A., Grzeda M.T., Macmillan T., Brand C., Sheikh Z.H., Antonini A. Clinical utility of DaTscan in patients with suspected Parkinsonian syndrome: a systematic review and meta-analysis. NPJ Parkinsons Dis. 2021;7:43. doi: 10.1038/s41531-021-00185-8. - DOI - PMC - PubMed

Substances