. 2025 Aug;301(8):110430.
doi: 10.1016/j.jbc.2025.110430. Epub 2025 Jun 26.

The ability of SAMHD1-deficient monocytes to trigger the Type I IFN response depends on cGAS and mitochondrial DNA

Affiliations

The ability of SAMHD1-deficient monocytes to trigger the Type I IFN response depends on cGAS and mitochondrial DNA

Jesse Rabinowitz et al. J Biol Chem. 2025 Aug.

Abstract

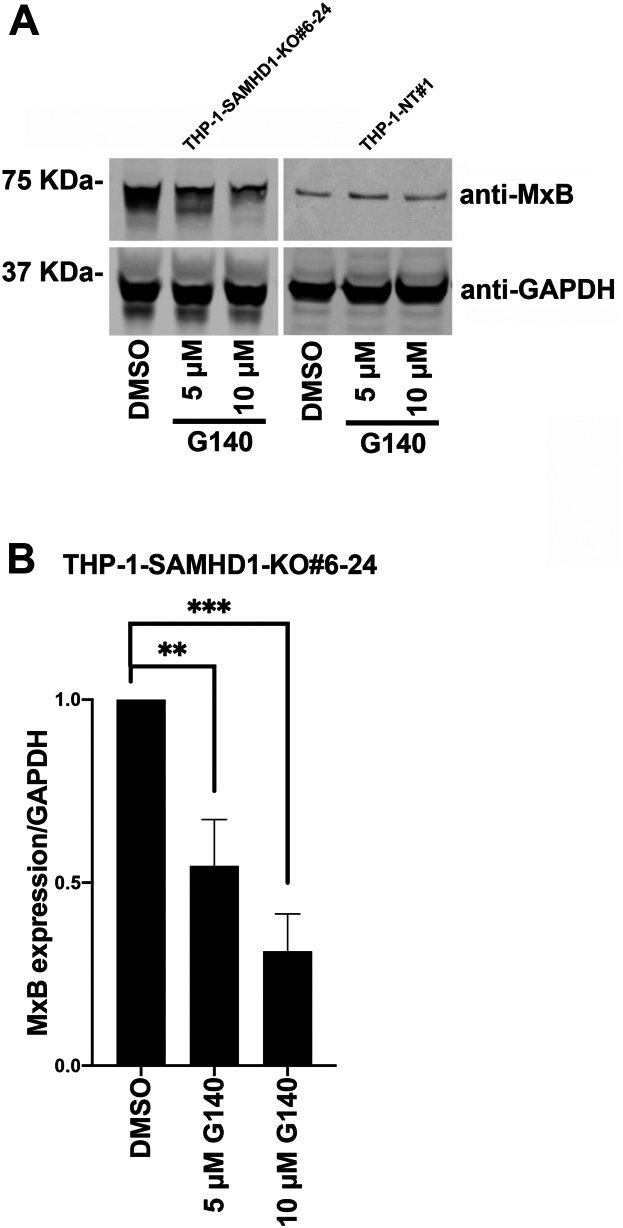
In humans, mutations in sterile α motif and histidine-aspartate domain-containing protein 1 (SAMHD1) lead to the development of a type I interferonopathy known as Aicardi-Goutières syndrome (AGS). AGS can present with a variety of severe phenotypes in patients, and a hallmark of this disease is chronic activation of type I interferon (IFN) signaling. However, the mechanism through which type I IFN signaling is activated in the absence of functional SAMHD1 is not known. Here, we investigated the molecular pathways that lead to type I IFN signaling activation in the absence of SAMHD1. Our investigations revealed that chronic activation of type I IFN signaling in SAMHD1-knockout (KO) monocytes is cyclic GMP-AMP synthase (cGAS)-dependent. Analysis of other nucleic acid sensors showed that type I IFN signaling in SAMHD1-KO cells is not dependent on melanoma differentiation-associated protein 5 (MDA5) or retinoic acid-inducible gene I (RIG-I). In agreement with our observation that type I IFN signaling is dependent on cGAS, two inhibitors of the cGAS-stimulator of IFN genes pathway, G140 and H151, effectively prevented type I IFN activation in SAMHD1-KO monocytes. We also found that type I IFN signaling in SAMHD1-KO monocytes is dependent on type I IFN receptor expression. Further exploration revealed mitochondrial malfunction in SAMHD1-KO monocytes that is likely to leak mitochondrial components into the cytoplasm. Overall, our work suggests that genetic knock out of SAMHD1 leads to mitochondrial disfunction, resulting in the presence of mitochondrial DNA in the cytoplasm, which triggers cGAS and the type I IFN response.

Keywords: Aicardi–Goutières syndrome; THP-1; cGAS; mitochondria; type I IFN response.


Conflict of interest statement

Conflict of interest The authors declare that they have no conflicts of interest with the contents of this article.

Figures

Figure 1
Figure 1
THP-1 cells with stable SAMHD1 knockout show increased expression of the interferon-stimulated gene MxB.A, THP-1 monocytes were transfected with Cas9 and either sterile α motif and histidine-aspartate domain–containing protein 1 (SAMHD1)-targeting guide RNA (gRNA) or non-targeting gRNA by electroporation. Single-cell clones were generated from larger pools of transfected cells. Three separate single-cell SAMHD1-knockout (KO) clones (6-24, 9-11, and 9-24) were identified by Western blot using antibodies against SAMHD1. Membranes were subsequently probed with antibodies against MxB. As a loading control, samples were probed with antibodies against GAPDH. Experiments were repeated twice, and a representative example is shown. B, quantification of the MxB band intensity normalized against the GAPDH band intensity. Data represent the mean and standard deviation for two independent experiments. Statistical analysis was performed using one-way analysis of variance. ∗∗, p < 0.01; ns, not significant. C, THP-1 SAMHD1-KO cells were analyzed for the surface expression of SIGLEC-1, an interferon activated gene, by flow cytometry using specific antibodies against SIGLEC-1 conjugated to Cy5.5. As control the indicated cells were treated with 1000U/ml of IFNα or IFNβ for 24 h. The Mean Fluoresce Intensity is shown for three independent experiments with standard deviation is shown. Statistical analysis was performed using one-way analysis of variance. ∗, p < 0.01; ∗∗∗∗, p < 0.0001. D, THP-1 SAMHD1 knockout cells were transduced with a lentiviral vector expressing FLAG-tagged SAMHD1 or an empty vector (pLVX) as a control. Protein expression was assessed by Western blot using antibodies against SAMHD1, MxB, and GAPDH. The experiment was performed three times, and a representative blot is shown.
Figure 1
Figure 1
THP-1 cells with stable SAMHD1 knockout show increased expression of the interferon-stimulated gene MxB.A, THP-1 monocytes were transfected with Cas9 and either sterile α motif and histidine-aspartate domain–containing protein 1 (SAMHD1)-targeting guide RNA (gRNA) or non-targeting gRNA by electroporation. Single-cell clones were generated from larger pools of transfected cells. Three separate single-cell SAMHD1-knockout (KO) clones (6-24, 9-11, and 9-24) were identified by Western blot using antibodies against SAMHD1. Membranes were subsequently probed with antibodies against MxB. As a loading control, samples were probed with antibodies against GAPDH. Experiments were repeated twice, and a representative example is shown. B, quantification of the MxB band intensity normalized against the GAPDH band intensity. Data represent the mean and standard deviation for two independent experiments. Statistical analysis was performed using one-way analysis of variance. ∗∗, p < 0.01; ns, not significant. C, THP-1 SAMHD1-KO cells were analyzed for the surface expression of SIGLEC-1, an interferon activated gene, by flow cytometry using specific antibodies against SIGLEC-1 conjugated to Cy5.5. As control the indicated cells were treated with 1000U/ml of IFNα or IFNβ for 24 h. The Mean Fluoresce Intensity is shown for three independent experiments with standard deviation is shown. Statistical analysis was performed using one-way analysis of variance. ∗, p < 0.01; ∗∗∗∗, p < 0.0001. D, THP-1 SAMHD1 knockout cells were transduced with a lentiviral vector expressing FLAG-tagged SAMHD1 or an empty vector (pLVX) as a control. Protein expression was assessed by Western blot using antibodies against SAMHD1, MxB, and GAPDH. The experiment was performed three times, and a representative blot is shown.
Figure 2
Figure 2
MxB expression in THP-1–SAMHD1 KO cells is cGAS-dependent.A, THP-1 monocytes with stable sterile α motif and histidine-aspartate domain–containing protein 1 (SAMHD1) knockout (KO; THP-1-SAMHD1-KO cells) were transfected with Cas9 and either cyclic GMP–AMP synthase (cGAS)-specific guide RNA (gRNA) or non-targeting gRNA by electroporation. Single-cell clones were selected from the larger population of transfected cells. Four single-cell clones with simultaneous SAMHD1 and cGAS KO (THP-1–SAMHD1-KO•cGAS-KO) were identified by Western blot using antibodies against cGAS. Additionally, samples were probed with antibodies against MxB. As a loading control, samples were probed with antibodies against GAPDH. Experiments were repeated twice, and a representative example is shown. B, quantification of the MxB band intensity normalized against GAPDH band intensity. Data represent the mean and standard deviation for two independent experiments. Statistical analysis was performed using one-way analysis of variance. ∗∗, p < 0.01; ns, not significant. C, intracellular 2′3′-cGAMP levels were analyzed in the indicated THP-1-SAMHD1-KO and non-targeting (NT) cells. Relative 2′3′-cGAMP levels in the clone cells are normalized to the 2′3′-cGAMP level obtained in the NT cells. Graphs represent means ± standard error from the mean (SEM) of (A) n = 3 independent experiments, (B) n = 4 independent experiments. Statistical analysis was performed using Student's t test. ∗∗, p < 0.01; ns, not significant.
Figure 2
Figure 2
MxB expression in THP-1–SAMHD1 KO cells is cGAS-dependent.A, THP-1 monocytes with stable sterile α motif and histidine-aspartate domain–containing protein 1 (SAMHD1) knockout (KO; THP-1-SAMHD1-KO cells) were transfected with Cas9 and either cyclic GMP–AMP synthase (cGAS)-specific guide RNA (gRNA) or non-targeting gRNA by electroporation. Single-cell clones were selected from the larger population of transfected cells. Four single-cell clones with simultaneous SAMHD1 and cGAS KO (THP-1–SAMHD1-KO•cGAS-KO) were identified by Western blot using antibodies against cGAS. Additionally, samples were probed with antibodies against MxB. As a loading control, samples were probed with antibodies against GAPDH. Experiments were repeated twice, and a representative example is shown. B, quantification of the MxB band intensity normalized against GAPDH band intensity. Data represent the mean and standard deviation for two independent experiments. Statistical analysis was performed using one-way analysis of variance. ∗∗, p < 0.01; ns, not significant. C, intracellular 2′3′-cGAMP levels were analyzed in the indicated THP-1-SAMHD1-KO and non-targeting (NT) cells. Relative 2′3′-cGAMP levels in the clone cells are normalized to the 2′3′-cGAMP level obtained in the NT cells. Graphs represent means ± standard error from the mean (SEM) of (A) n = 3 independent experiments, (B) n = 4 independent experiments. Statistical analysis was performed using Student's t test. ∗∗, p < 0.01; ns, not significant.
Figure 3
Figure 3
Pharmacological inhibition of the cGAS pathway using G140 prevents MxB upregulation in THP-1–SAMHD1-KO cells.A, THP-1 monocytes with stable sterile α motif and histidine-aspartate domain–containing protein 1 (SAMHD1) knockout (KO; THP-1-SAMHD1-KO cells) were treated with five or 10 μM G140 or an equivalent amount of dimethyl sulfoxide (DMSO). Three days post-treatment, cells were washed with 1× phosphate-buffered saline (PBS) and treated a second time. Three days after the second treatment, cells were lysed and subjected to Western blot analysis using antibodies against MxB and the loading control GAPDH. Experiments were repeated three times, and a representative example is shown. B, quantification of MxB band intensity normalized against the GAPDH band intensity. Data represent the mean and standard deviation for three independent experiments. Statistical analysis was performed using one-way analysis of variance. p < 0.01; ∗∗∗, p < 0.001; ns, not significant.
Figure 4
Figure 4
Pharmacological inhibition of the stimulator of interferon genes pathway using H151 prevents MxB upregulation in THP-1–SAMHD1-KO cells.A, THP-1 monocytes with stable SAMHD1 knockout (KO; THP-1-SAMHD1-KO cells) were treated with 0.5, 1, 2, 4, or 8 μM H151 or an equivalent amount of dimethyl sulfoxide (DMSO). Three days post-treatment, cells were washed with 1× phosphate-buffered saline (PBS) and treated a second time. Three days after the second treatment, cells were lysed and subjected to Western blot analysis using antibodies against MxB and the loading control GAPDH. Experiments were repeated three times, and a representative example is shown. B, quantification of the MxB band intensity normalized against the GAPDH band intensity. Data represent the mean and standard deviation for three independent experiments. Statistical analysis was performed using one-way analysis of variance. ∗, p < 0.05; ∗∗∗, p < 0.001; ∗∗∗∗, p < 0.0001; ns, not significant.
Figure 5
Figure 5
MDA5 knockout does not prevent MxB expression in THP-1–SAMHD1-KO cells.A, THP-1 monocytes with SAMHD1 knockout (KO; THP-1-SAMHD1-KO cells) were transfected with Cas9 and either melanoma differentiation-associated protein 5 (MDA5)-specific guide RNA (gRNA) or non-targeting gRNA by electroporation. Single-cell clones were isolated from the population of transfected cells. Three single-cell clones with simultaneous SAMHD1 and MDA5 KO (THP-1–SAMHD1-KO•MDA5-KO) were identified by Western blot using antibodies against MDA5. Additionally, samples were probed with antibodies against MxB. Antibodies against GAPDH were used as a loading control. Experiments were repeated twice, and a representative example is shown. B, quantification of the MxB band intensity normalized against the GAPDH band intensity. Data represent the mean and standard deviation for two independent experiments.
Figure 6
Figure 6
RIG-I knockout does not inhibit MxB expression in THP-1–SAMHD1 KO cells.A, THP-1 monocytes with stable SAMHD1 knockout (KO; THP-1-SAMHD1-KO cells) were transfected with Cas9 and either retinoic acid–inducible gene I (RIG-I)-specific guide RNA (gRNA) or non-targeting gRNA by electroporation. Single-cell clones were isolated from the larger pool of transfected cells. Three single-cell clones with simultaneous SAMHD1 and RIG-I KO (THP-1–SAMHD1-KO•RIG-I-KO) were identified by Western blot using antibodies against RIG-I. Additionally, samples were probed with antibodies against MxB. Antibodies against GAPDH were used as a loading control. Experiments were repeated twice, and a representative example is shown. B, quantification of the MxB band intensity normalized against the GAPDH band intensity. Data represent the mean and standard deviation for two independent experiments. Statistical analysis was performed using one-way analysis of variance. ns, not significant.
Figure 7
Figure 7
MxB expression in THP-1–SAMHD1-KO cells is dependent upon IFNAR expression.A, THP-1 monocytes with stable SAMHD1 knockout (KO; THP-1-SAMHD1-KO cells) were transfected with Cas9 and either interferon-alpha (IFNα) receptor (IFNAR)-specific guide RNA (gRNA) or non-targeting gRNA by electroporation. Single-cell clones were isolated from the larger population. Three single-cell clones with simultaneous SAMHD1 and IFNAR KO (THP-1–SAMHD1-KO•IFNAR-KO) were identified by treatment with 1000 U/ml IFNα. Additionally, samples were probed with antibodies against MxB. Antibodies against GAPDH were used as a loading control. Experiments were repeated twice, and a representative example is shown. B, quantification of the MxB band intensity normalized against the GAPDH band intensity. Data represent the mean and standard deviation for two independent experiments. Statistical analysis was performed using one-way analysis of variance. ∗, p < 0.05; ∗∗∗, p < 0.001; ns, not significant.
Figure 8
Figure 8
Less active mitochondria are observed in SAMHD-1-KO cells.A, mitochondria was stained in live cells by incubating the THP-1-SAMHD1-KO and non-target clones(generated using CRISPR/Cas9) in 400 nM of the Mito Tracker Green MF for 20 min at 37 °C. Staining was detected by flow cytometry measuring green fluorescence in the channel BB515-A using a FACSCelesta. Experiments were repeated three times, and a representative experiment is shown. B, similar to (A), mitochondria were stained in THP-1-SAMHD1-KO and empty vector cells (generated using plentiCRISPR/Cas9).These THP-1-SAMHD1-KO cells were generated using the plentiCRISPR/Cas9 vector previously published (28). Green fluorescence was measured using a FACSCelesta. Experiments were repeated three times, and a representative experiment is shown. As a control, cells were treated with carbonyl cyanide m-chlorophenyl hydrazone (CCCP), which increases the accumulation of MitoTracker Green FM in the mitochondria. C, the state of Mitochondrial oxidative phosphorylation for wild type and SMAHD1-KO clones was measured by determining the enzymatic activity of the enzyme Citrate synthase as described in the Experimental procedures section. Statistical analysis was performed using one-way variance. ∗, p < 0.05; ∗∗∗, p < 0.001. D, mitochondrial DNA content for wild type and SAMHD1-KO clones was measured by measuring the ratio of mitochondrial to nuclear DNA by RT-PCR as described in the Experimental procedures section. Statistical analysis was performed using one-way variance. ∗, p < 0.05; ∗∗, p < 0.01. E, sequencing of cytoplasmic DNA in wild type and SAMHD1-KO cells. Total DNA was extracted from pure cytoplasmic fractions and sequenced. A heatmap of differentially detected DNA levels in the cytoplasm of each cell population is shown. Chromosomal (left) and mitochondrial (right) genes are depicted side by side. F, box plot of the normalized read count per mitochondrial gene in each indicated cell population (n = 36 genes). G, non-target and SAMHD1-KO THP-1 cells were treated with the indicated concentrations of the small molecule VBIT-4 for 48 h. Cell extracts were then analyzed by Western blotting using anti-MxB and anti-GAPDH antibodies. The experiments were performed three times, and a representative blot is shown.

References

    1. Arfi V., Riviere L., Jarrosson-Wuilleme L., Goujon C., Rigal D., Darlix J.L., et al. Characterization of the early steps of infection of primary blood monocytes by human immunodeficiency virus type 1. J. Virol. 2008;82:6557–6565. - PMC - PubMed
    1. Baldauf H.M., Pan X., Erikson E., Schmidt S., Daddacha W., Burggraf M., et al. SAMHD1 restricts HIV-1 infection in resting CD4(+) T cells. Nat. Med. 2012;18:1682–1687. - PMC - PubMed
    1. Descours B., Cribier A., Chable-Bessia C., Ayinde D., Rice G., Crow Y., et al. SAMHD1 restricts HIV-1 reverse transcription in quiescent CD4+ T-cells. Retrovirology. 2012;9:87. - PMC - PubMed
    1. Goujon C., Arfi V., Pertel T., Luban J., Lienard J., Rigal D., et al. Characterization of simian immunodeficiency virus SIVSM/human immunodeficiency virus type 2 Vpx function in human myeloid cells. J. Virol. 2008;82:12335–12345. - PMC - PubMed
    1. Hrecka K., Hao C., Gierszewska M., Swanson S.K., Kesik-Brodacka M., Srivastava S., et al. Vpx relieves inhibition of HIV-1 infection of macrophages mediated by the SAMHD1 protein. Nature. 2011;474:658–661. - PMC - PubMed

MeSH terms

Supplementary concepts

LinkOut - more resources